Umeå Urban Climate Performance
Contributors





Funding

Initiatives

About
The Umeå Urban Climate Performance application was initiated as an Infravis project, working with Weizhou Lus team at Umeå University to visualize their research about climate performance of homes in the Umeå area and disseminate the data to the public. The goal of the project was to create an interactive 3D application for touch table use, that allows the user to explore the climate performance of homes in the Umeå area and possible positive and negative effects of renovations and behaviors of the residents. The data is interesting both on individual home level, as well as neighborhood and city level, so a goal was to create a tool to explore the data on all three levels.
The data
The data provided by Lus team covers about 7000 homes in the Umeå area, identified by an address and longitude/latitude coordinates. The data covers three categories of climate performance:

- Energy use (kWh/m²/year)
- CO₂ emission (gCO₂e/kWh/m²)
- Climate (heat) resilience (too-hot hours/year, indoor temperatures above 26°C)¨
All three categories have a base value, and multiple modifier values that can be both positive or negative. Examples of modifiers are:
- Renovations of parts of the building such as windows and roof, which make the building more efficient
- Behaviors such as excessive window opening, which wastes energy in colder seasons
- At the same time, active window opening has a positive effect on indoor temperature if used correctly. For energy use and CO₂ emission these modifiers are shared, and climate resilience has its own set of modifiers. Overall, the data shows that both renovations of the homes and the behavior of the residents affects these parameters. It should be noted that each modifier is simulated individually, so combining two modifiers is not possible at the current state of the research.
The data was provided as 3 Excel spread sheets, covering 3 different simulation years. 2030, 2050 and 2080.
Data integrity
Since the data covers individual homes, there are some limitations to how the data can be used. The data can't be used with a public tool like OpenMaps, since this requires that the data is uploaded to OpenMaps. Rather, the data needs to handled with offline solutions.
Data cleanup
The data was not perfect when we received it, and some modifications had to be made
- The coordinates of addresses where sometimes highly inaccurate, pointing only to the general area or street instead of the exact building. This was fixed by running each address through a Google Maps API and finding more precise coordinates.
- The addresses had a variety of formatting variation, which made it harder to work with and made the UI vary in strange ways. The data was run through a Python script to fix this.
Project goal
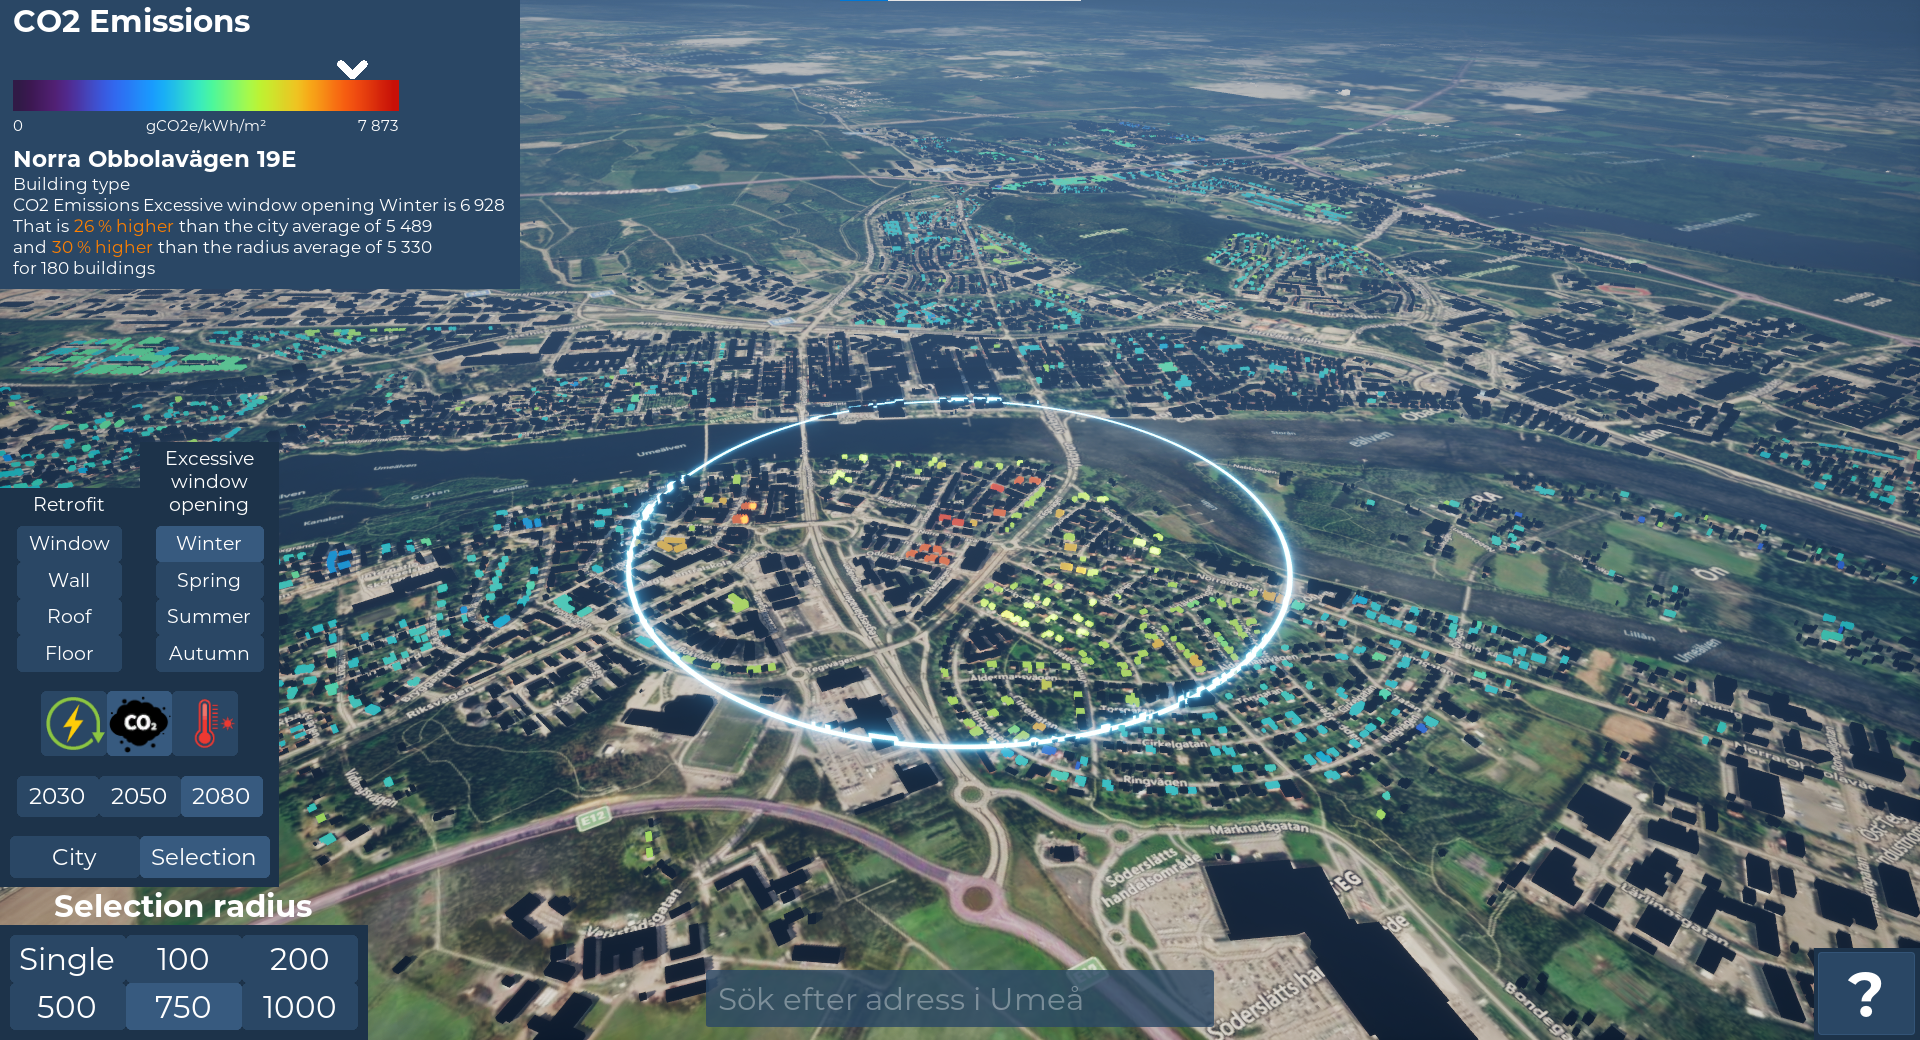
The goal of the project was to create an application for users to explore the data on their own. By providing tools for navigating the 3D city and swapping between the different datasets, the user can explore the data both on city, neighborhood and individual address level.
City visualization
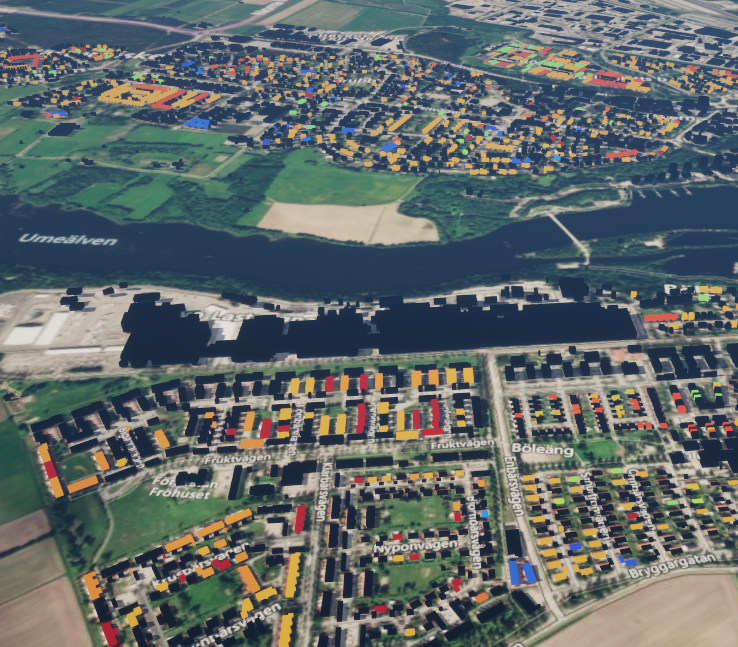
The data is visualized by color grading all the buildings in the dataset on a 3D map. This gives the user an overview of the data and makes it easy to identify buildings with higher and lower performance.
The csv data is brought into Unreal as data tables, and is connected to a series of textures that represent the data in a material friendly format that can be applied to the 3D buildings.
The base layers gives the user an overview about how the buildings are performing in an unchanged state, and the UI then lets them explore potential scenarios which can have positive and negative affects, by applying modifiers such as renovations or resident behaviors. The modifiers can either be applied to the whole city, or just to the current selection.
The UI also provides additional detailed information about the selected building, allowing the user to compare the selected building to the city. There is also a radius selection mode, which allows you to compare the current selection to neighboring houses.
UV mapping method
The application uses a UV mapping technique to apply the color gradient of each dataset to individual buildings using textures. Applying individual colors to 7000 unique buildings would not be performant in Unreal Engine, both because it is hard to handle that many unique static meshes in UE, and because it would demand a lot of draw calls.

A better way is to use one single mesh that covers the entire city, and then color the individual faces of the buildings. To do this, a UV mapping method inspired by this video from PrismaticaDev was used.
The core idea is that the 3D model should be UV unwrapped in a way, such that the vertices of each building should be gathered at a single point on the UV map. Each point is the position of a pixel in a predetermined texture size, and thus each building is placed on the UV map in a grid-like fashion. You can then apply a texture to the model where each pixel holds a color, and that color will be applied to the individual building. This allows us to convert the spreadsheet data to texture space, by mapping the column values of the data to a 0-255 range on a gray scale texture. The gray scale values are then used to sample colors from a gradient.
Implementation
The UV mapping method done in practice through Python scripts, in two steps:
- A map of central Umeå is downloaded from OSM. By running through the coordinates of each address we find a matching mesh and UV map it to the corresponding UV index. If we find no match for an index that UV position is simply left empty. Any remaining meshes is placed on UV position (1,1) so we know to ignore them.
- We run through each years csv, and generate a texture for each column in the csv with numeric values. Values are mapped in a 0-255 ranged based on a min and max value. The min/max values are calculated by grouping values with the same unit across all sample years, and finding the min and max. However, we ended up using 0 as min for all values, as it made more sense for the data.
The textures are then brought into Unreal Engine to be applied with a material to the mesh, which makes for an instant swapping of data by changing the texture parameter. The highlight of selected buildings is done by applying a blinking effect to the material. We find the selected indices in the dataset and generate a highlight mask using a render target. This mask can then be used to only highlight selected buildings, and it doubles as a mask when we want to only apply a modifier to the selection.
One would assume that we could use this runtime texture generation for all textures, but it proved very slow to draw a texture with 1000s of pixels, compared to just drawing a handful of pixels for a highlight mask. This could however be an acceptable approach if you prioritize flexibility over load speed and can accept some stutter.
Limitations
There are of course some limitations to the UV mapping method:
- Some addresses fall outside of the area of Umeå area we download from OSM, and thus get no color representation on the UV mapped mesh. You can however still go to those addresses and get the text based data about them. This was a limitation due to the Cesium terrains shape, as we either got clipping or floating meshes if we moved to far away from the city center.
- Sometimes multiple addresses (e.g. Jägarvägen 19A/D) mapped to the same mesh, usually an apartment building. In those cases we mapped the first instance to the mesh and subsequent addresses point to the same mesh, if the only difference is the address letter suffix.
- Some addresses can contain extra meshes, such as a garage. In these cases, only the closest mesh hit is used.
- If you want to add address rows to the dataset, you will need to rebuild the mesh and reimport it into Unreal Engine. Adding dataset columns also takes some manual labour as you need to add the new textures and assign them to the data table in Unreal Engine.
Web application
Alongside the touch table application, a lighter web version was developed during the same project period, built with JavaScript and CesiumJS instead of Unreal Engine. The goal was to make the data explorable directly in a browser. Since a public web tool has a much wider and less controlled audience than a touch table, the underlying data was anonymized and generalized before being used in this version — see Data generalization below.
Differences from the touch table application
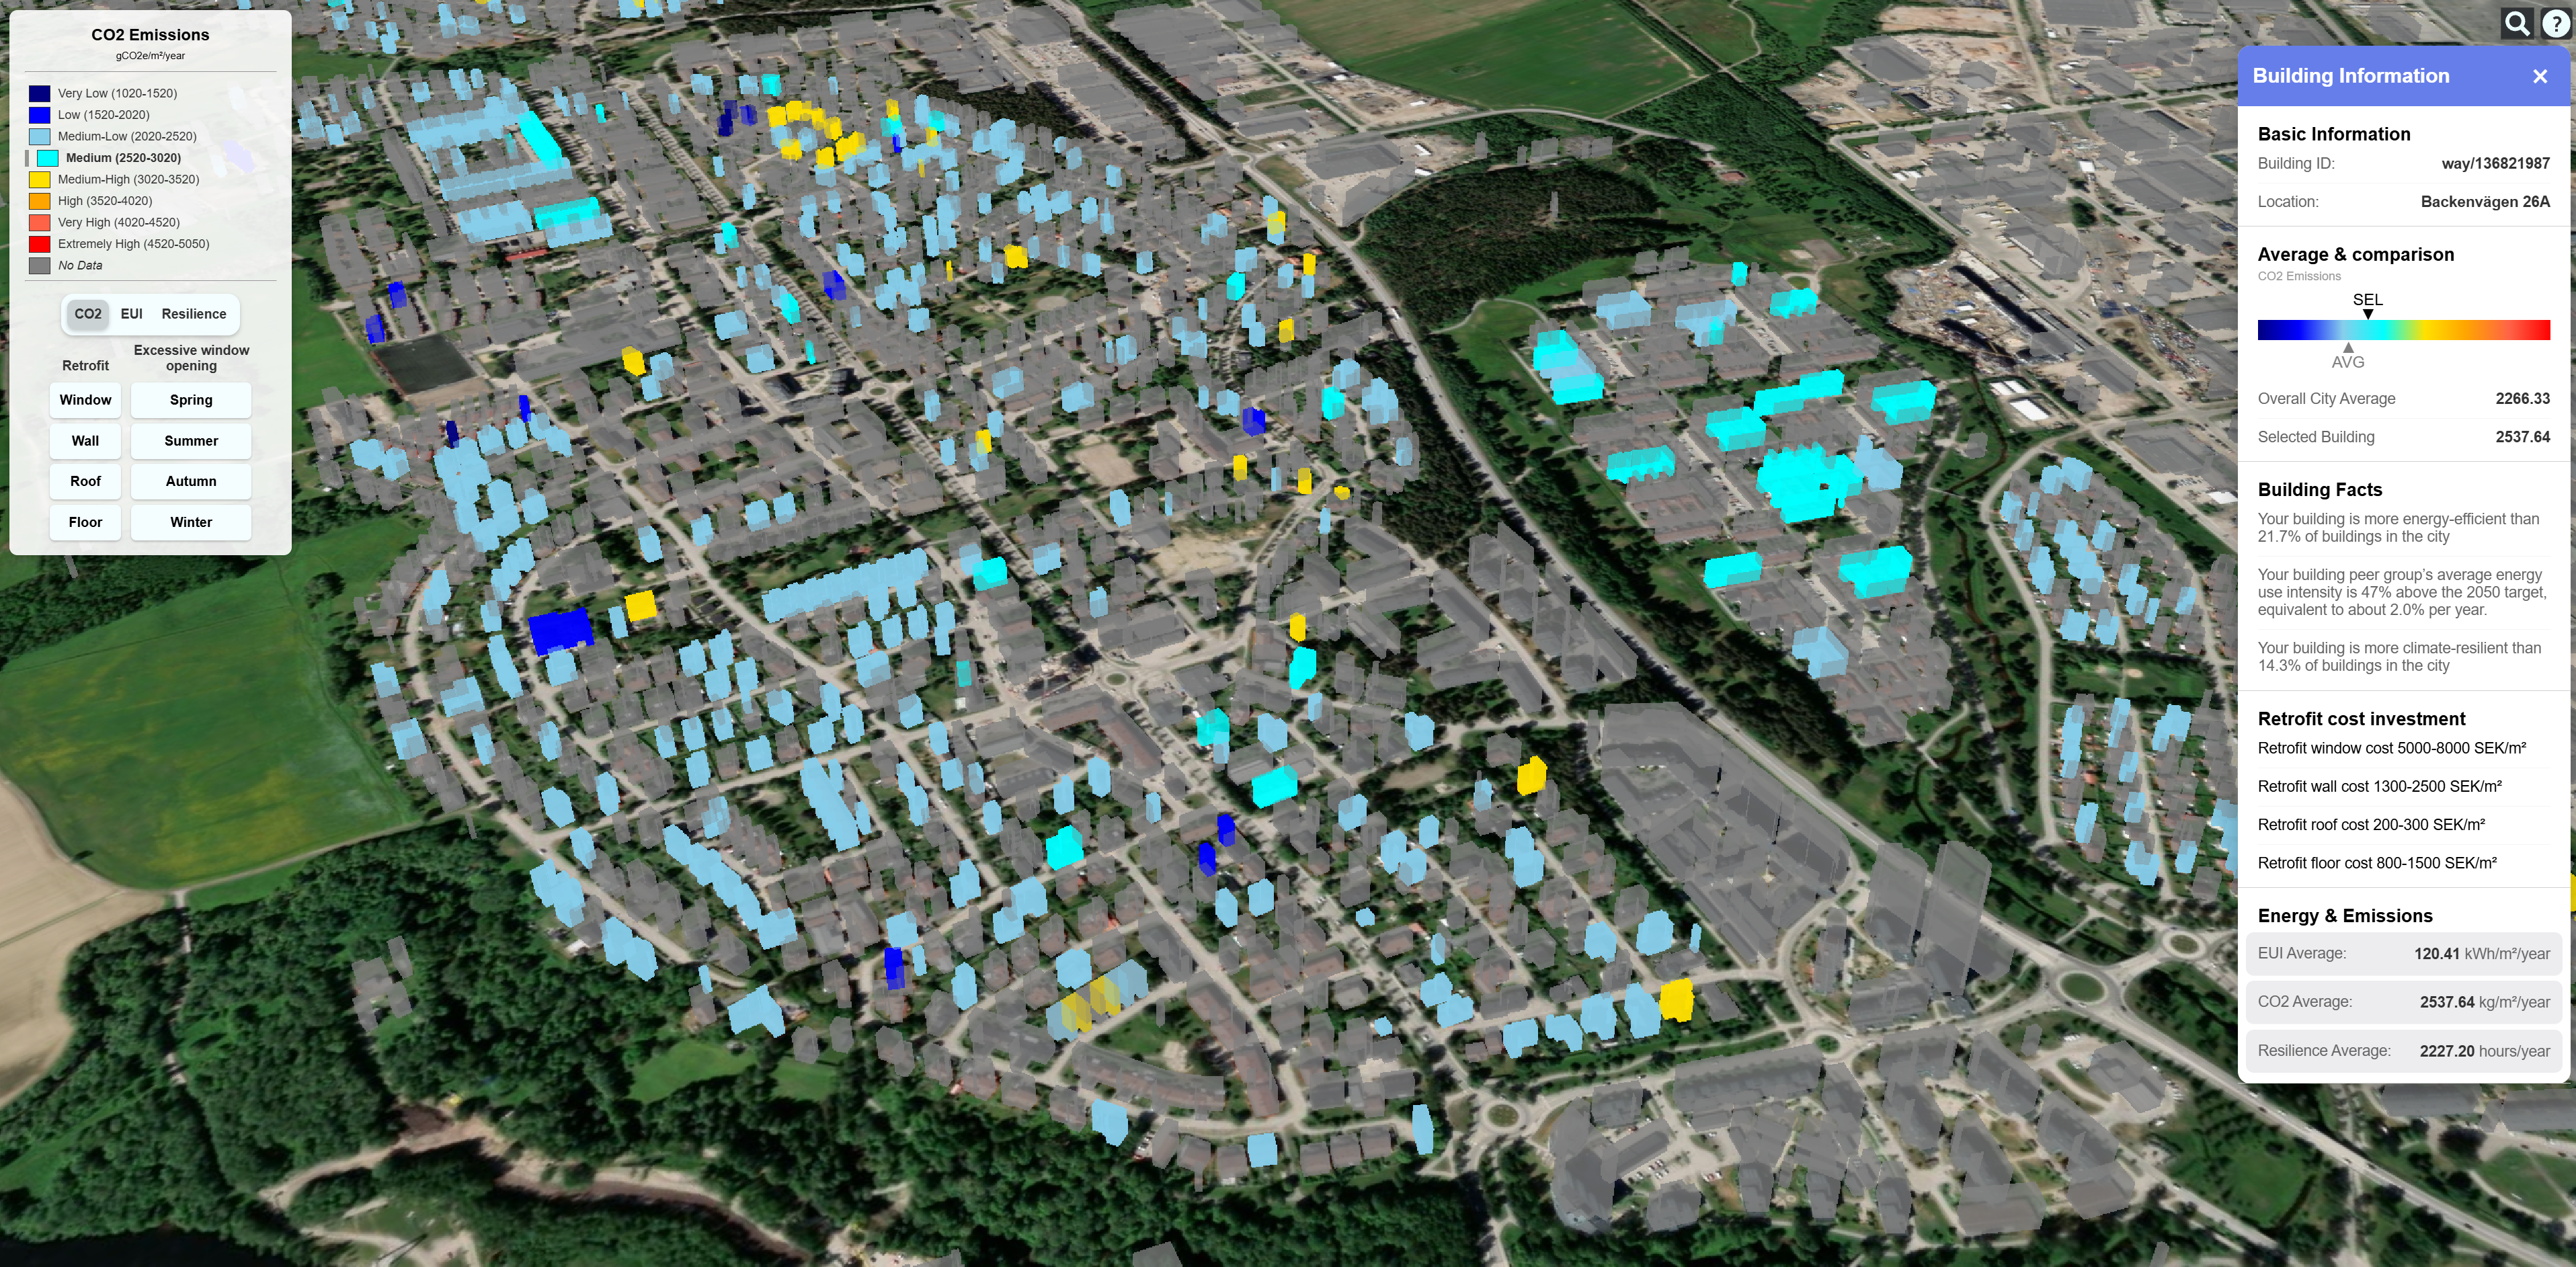
The web application covers the same three climate performance categories (energy use, CO₂ emission, and climate/heat resilience) and the same set of renovation and behavior modifiers, but is scoped down in a few ways:
- Only the 2030 simulation year is included, rather than all three (2030, 2050, 2080).
- Only a single building can be selected at a time. There is no area/radius selection mode — the selected building is instead compared directly to a precomputed city-wide average.
- Modifiers still cannot be combined with each other, consistent with the original research data.
Data generalization
Since the web application is public-facing rather than running on a controlled touch table, the dataset was generalized before use. Rather than exposing exact, individual performance figures, the data has been adjusted to a lower level of detail, while still preserving the overall spatial and statistical patterns across the city.
Implementation
The web application loads building geometry and climate data together from a single GeoJSON file, using the same attribute keys as the Excel-based dataset used in the touch-table version. This avoids the UV-mapping workaround described above: rather than baking data into textures, each building is rendered as its own geometry instance within one merged Cesium primitive, with a color attribute that can be updated directly. Buildings are extruded to a height based on their number of levels, taken from OpenStreetMap building data.
Colors are assigned from fixed-range scales, one per data category (energy use, CO₂ emission, resilience), each divided into eight color-graded steps. Buildings with no data for the selected attribute are shown in gray. Average values for each attribute are precomputed once when the data loads, and per-building values are cached, so switching between attributes or selecting a building doesn't require re-reading the dataset each time.
Selecting a building is done by clicking directly on it, or by searching an address, which flies the camera to the location and automatically selects the building at the center of the view. The selected building is highlighted with a pulsating color effect, and an info panel shows its values for the current attribute plotted on the same color scale as the legend, alongside a marker for the city-wide average — giving a quick visual comparison between the selected building and the city as a whole.