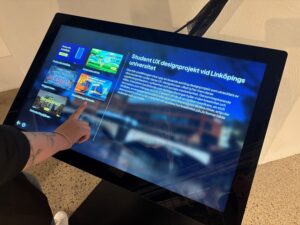
Student Dashboard
Contributors


Funding



Initiatives

Overview
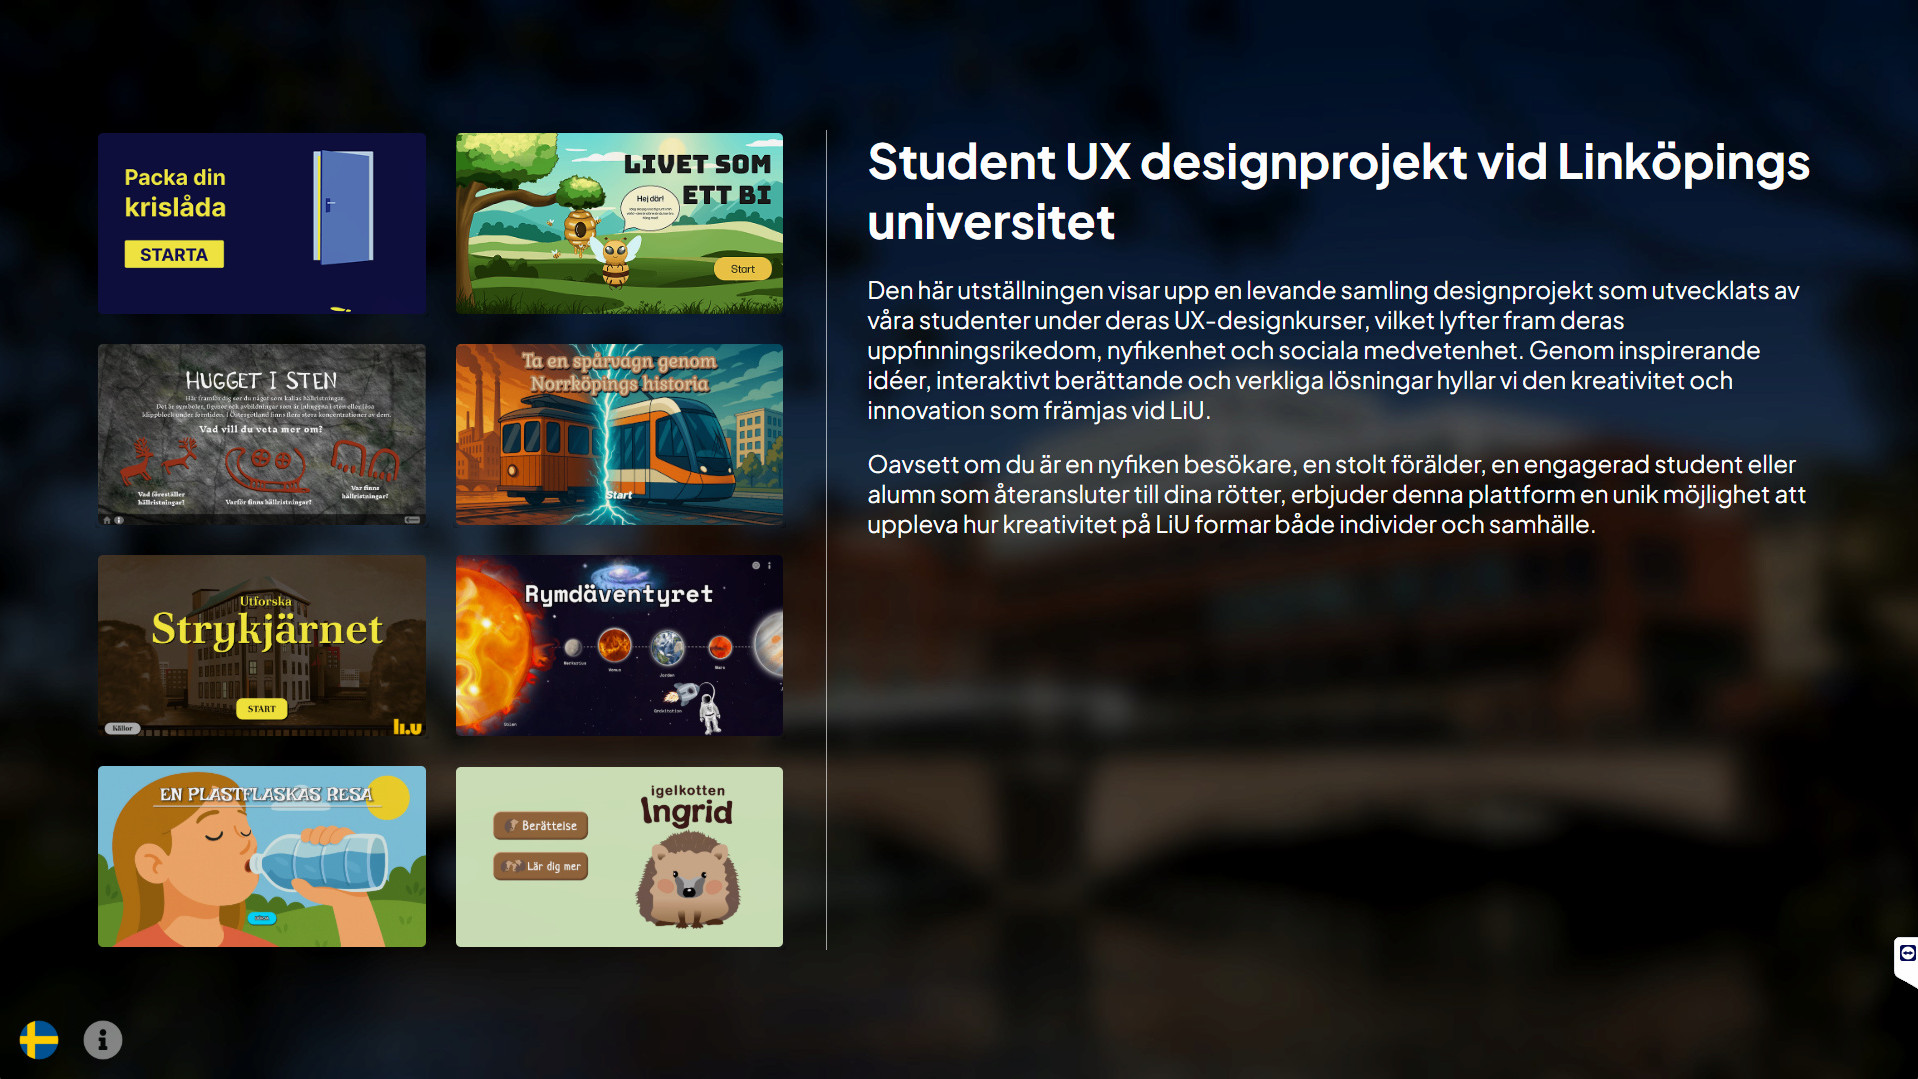
This interactive dashboard acts as a public-facing portal for exploring user experience and interface design work created by Linköping University students.
The installation features a catalog of student work drawn from prominent LiU media technology, interaction design, and graphics courses, including 6KGDK, 6CMEA, 6MDES, TNGD34, and TNM100.
Visual LIFT
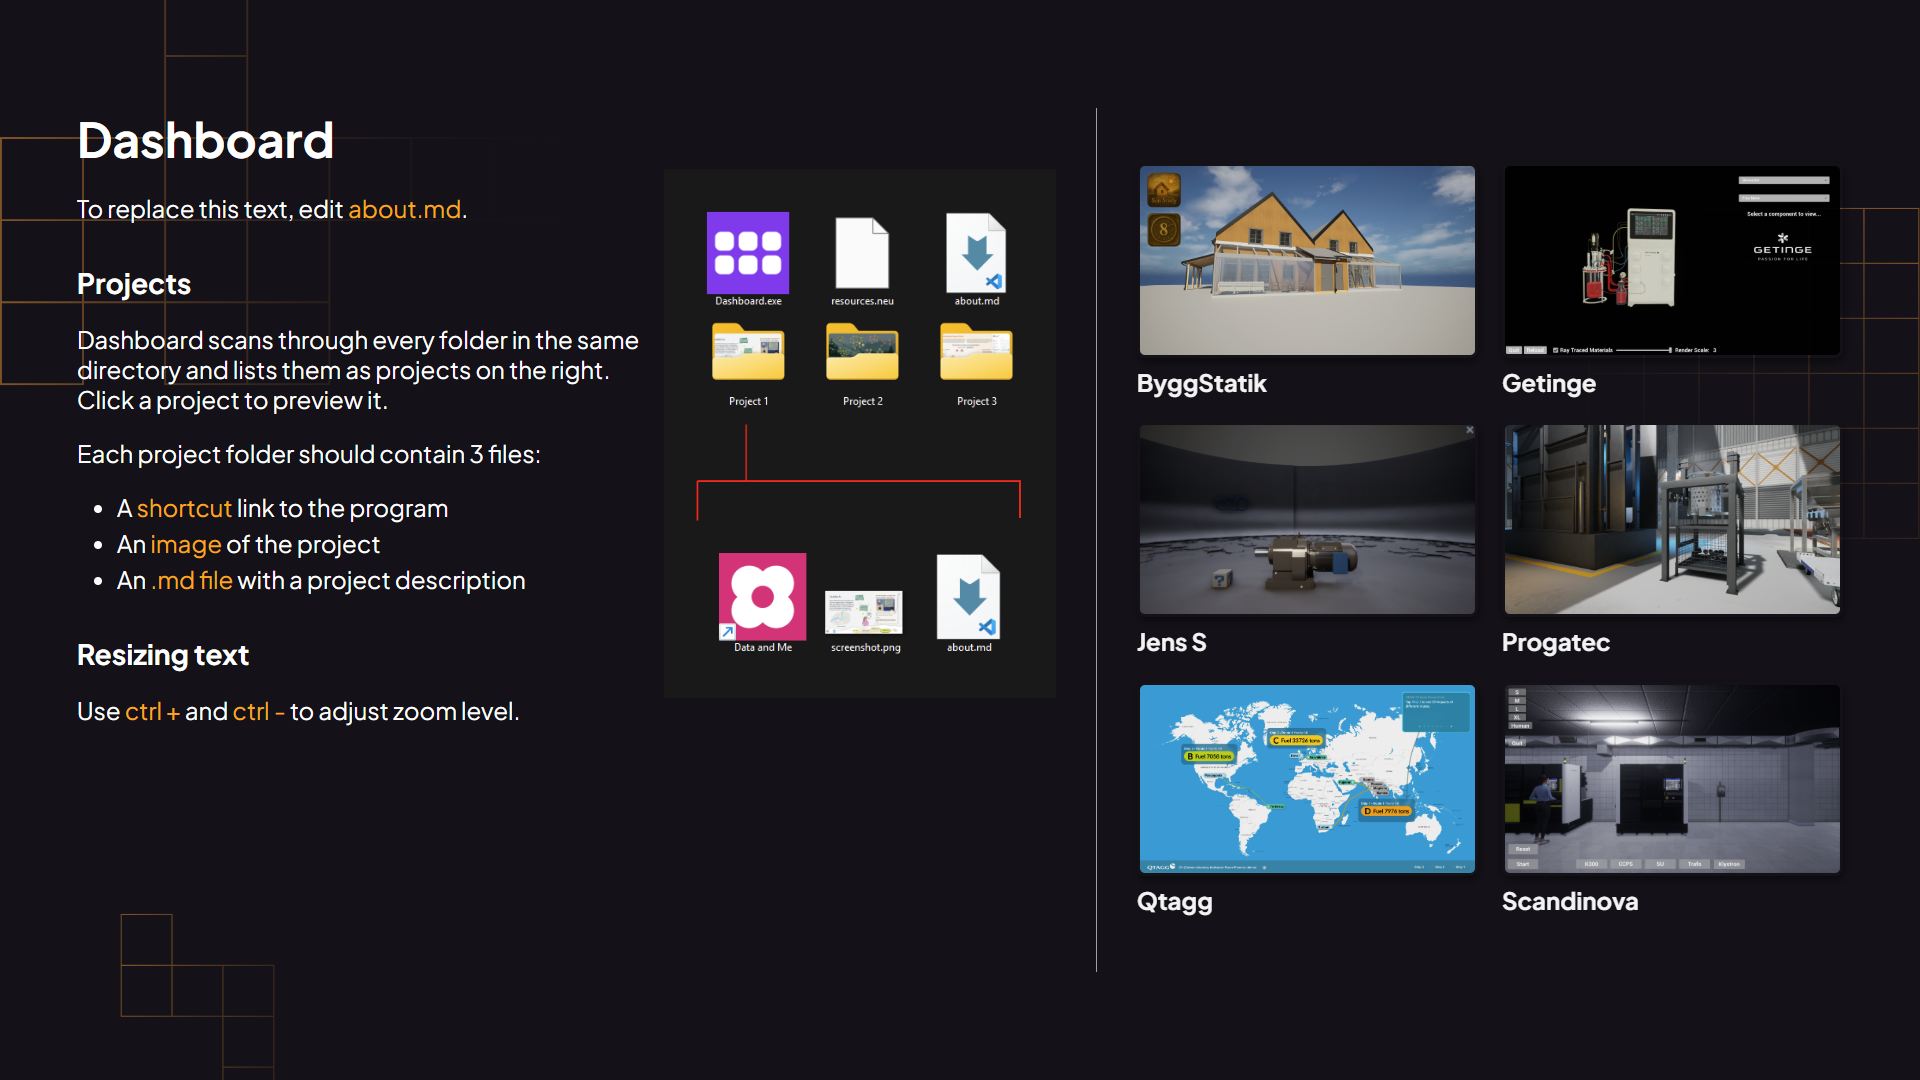
The dashboard was originally engineered as a dedicated launcher system for the Visual LIFT initiative. Its purpose was to serve as a public-facing kiosk that allowed visitors to boot and swap between various Unreal Engine applications without granting them access to the computer.
We later adapted the architecture into a web-integrated showcase for student projects. The dashboard loads Figma prototypes as iframes directly into the browser. This allows students to test their prototypes and make updates without our support.
Analytics
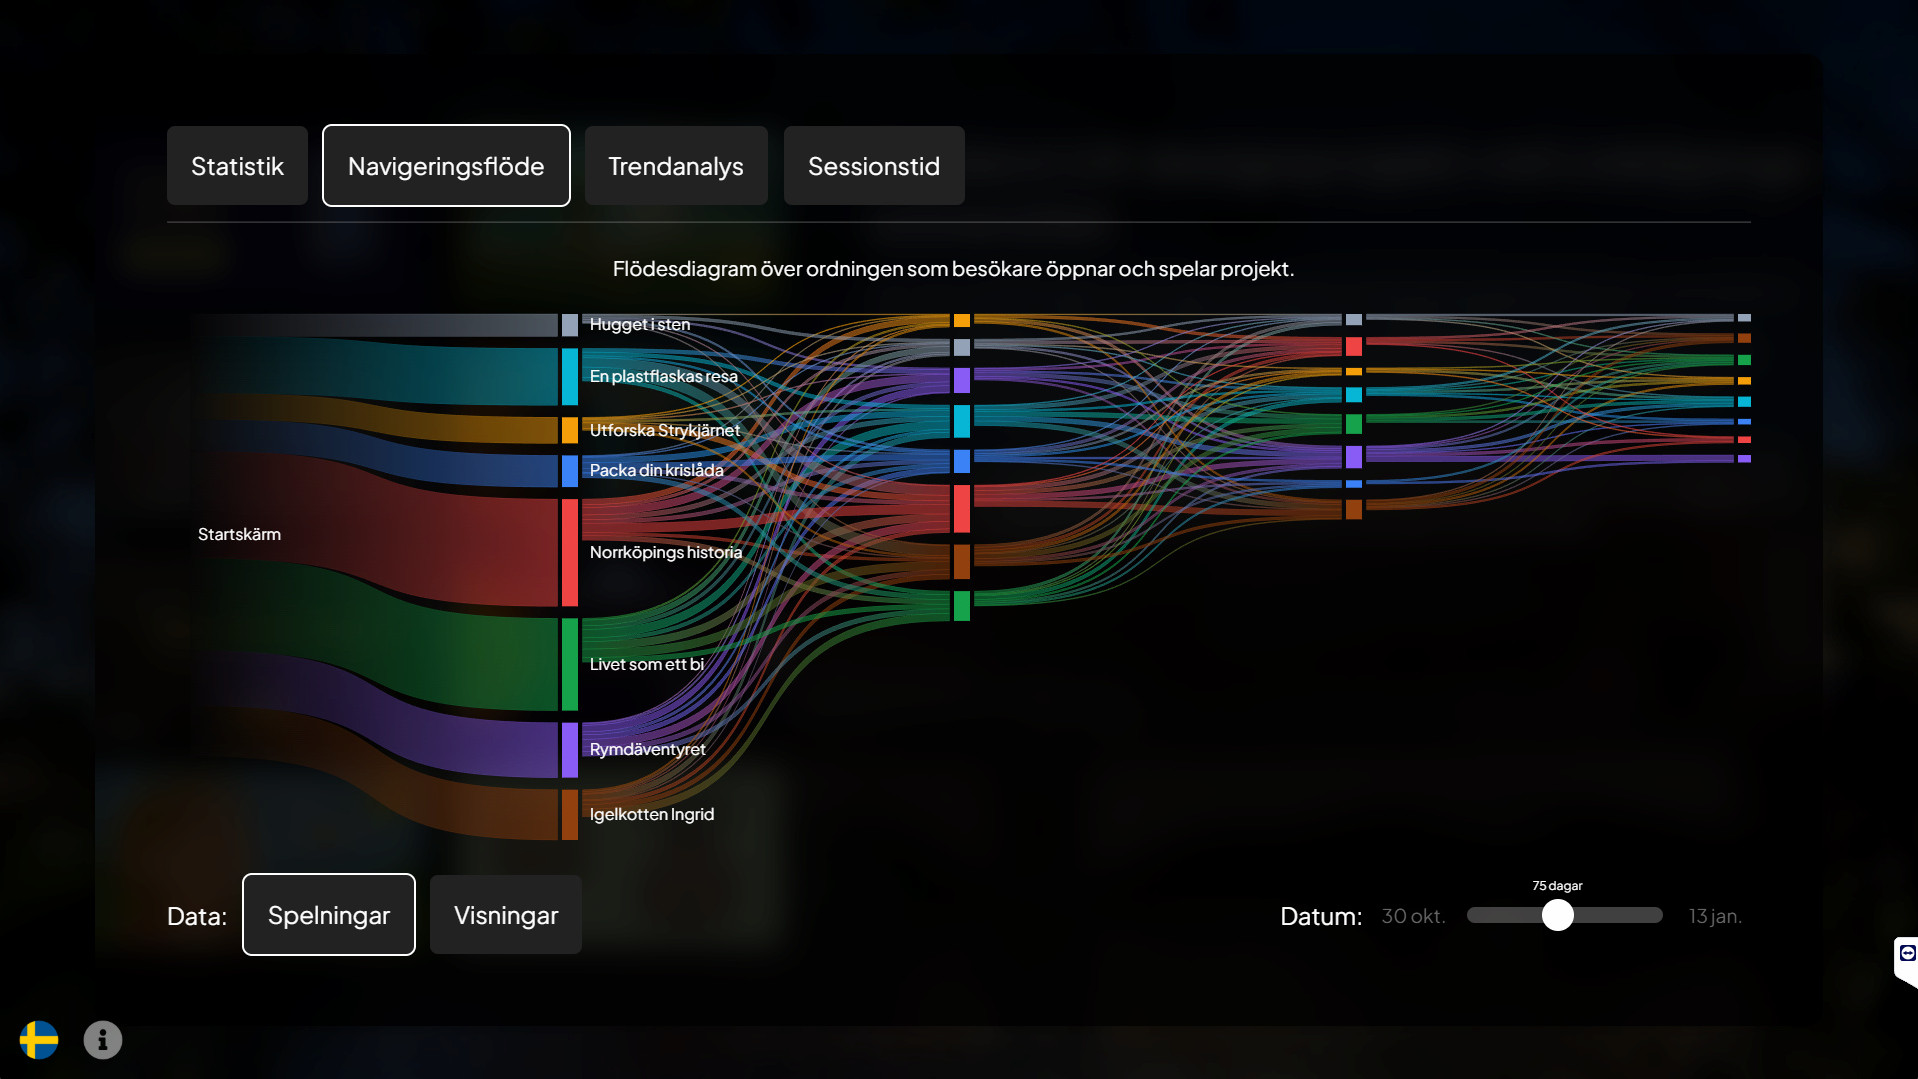
The dashboard provides a telemetry pipeline to log visitor interaction patterns in real time. The platform processes interactions with the system and presents metrics across four analytics modules:
- Engagement Metrics: A spreadsheet of all metrics, logging total views, plays, duration, skips, etc.
- User-Journey: A Sankey graph that visualizes which project visitors choose as their entry point, which applications they navigate to subsequently, and the overall narrative pathways taken through the gallery.
- Trend Analysis: A line plot mapping total views, plays over time, both relative and cumulative.
- Retention Graph: A retention graph that captures how long a visitor remains actively engaged with an application before losing interest and navigating away.