SimStad








Technical Guide
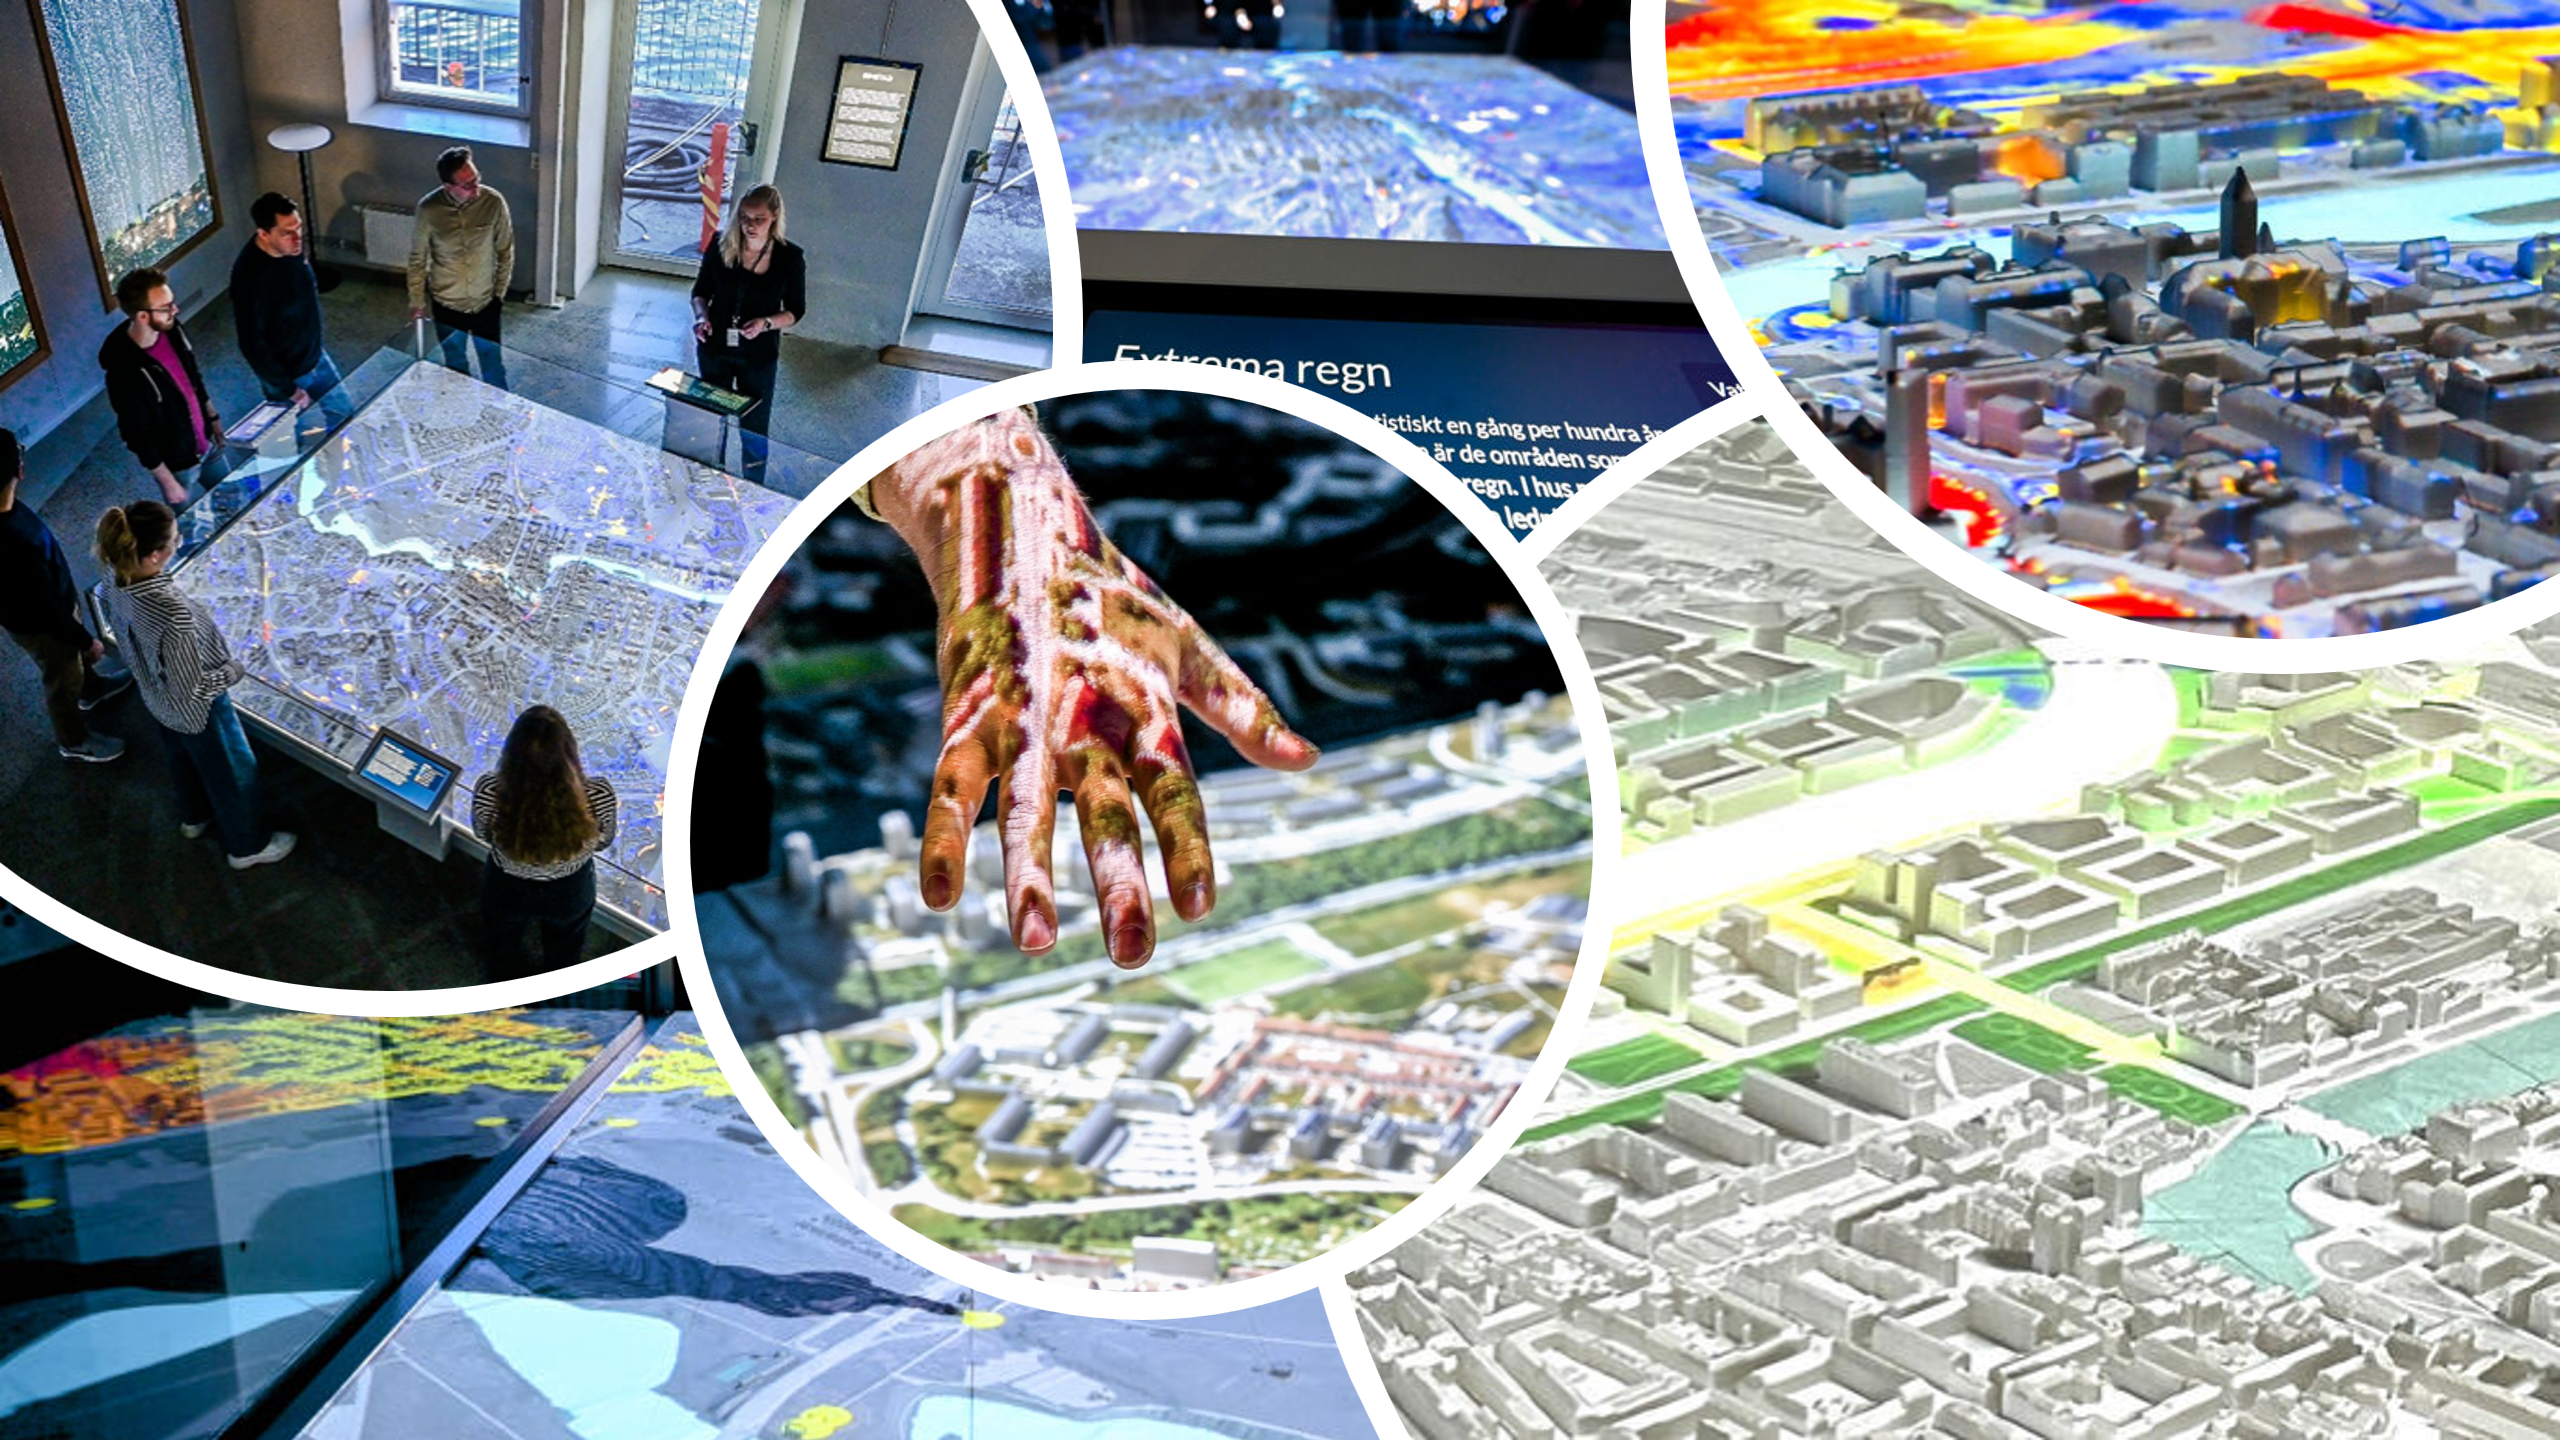
This deployment guide details the hardware and software architecture of the SimStad exhibition originally developed for Visualization Center C in Norrköping.
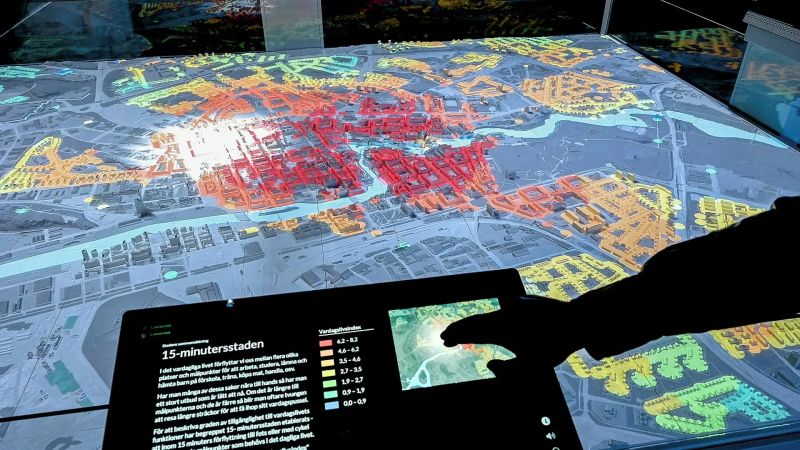
SimStad bridges the gap between spatial analysis and public outreach, allowing municipalities and urban planners to visualize data about their city over a physical landscape.
 Project page
System Architecture
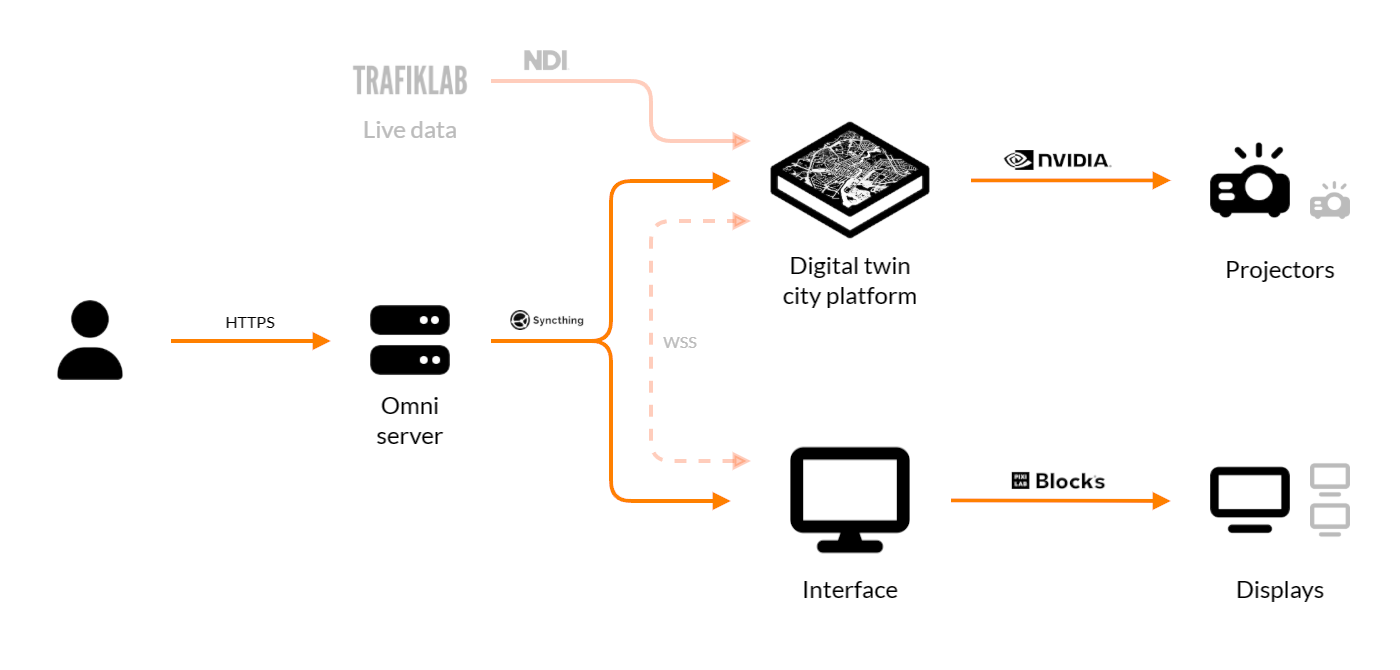
The SimStad exhibition is a modular system where map data, projection, and interactive screens communicate in real time over a localized web server.
Omni server
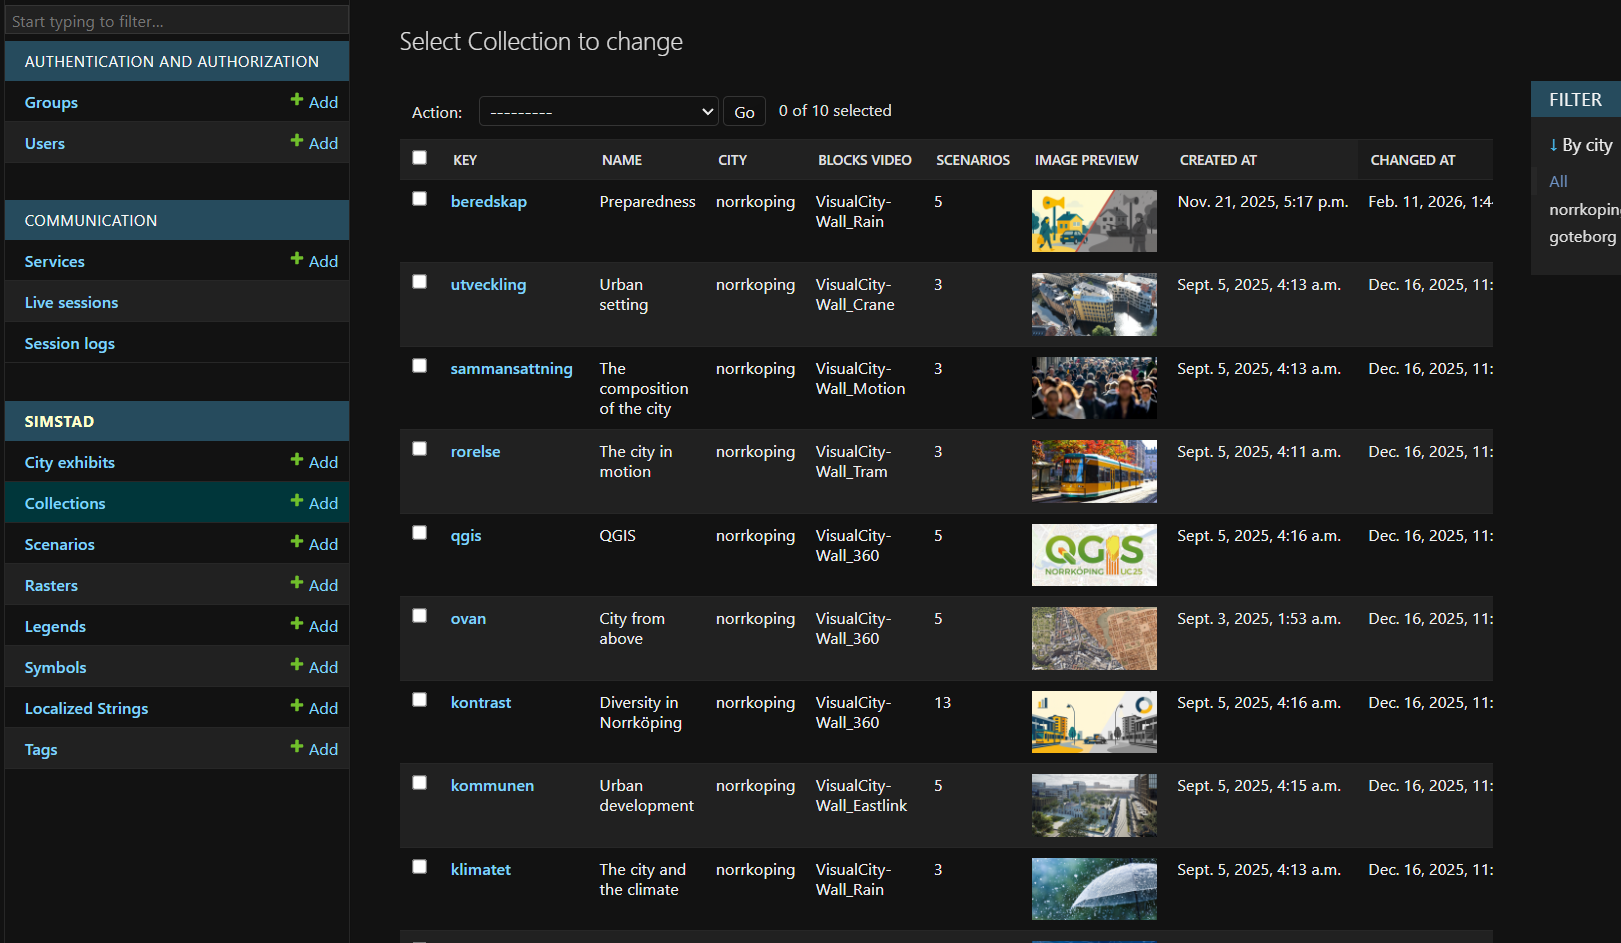
Omni is the backend infrastructure and content manager for SimStad. It has a web-interface where maintainers can upload and modify data and update the exhibition.
The system consists of 2 parts:
- A database for SimStad's content, including rasterized maps, videos, legends, stories, etc.
- A communication hub between devices (see guide), primarily used in WisDome for mass-interactivity
Read more
 Source code
3D Print
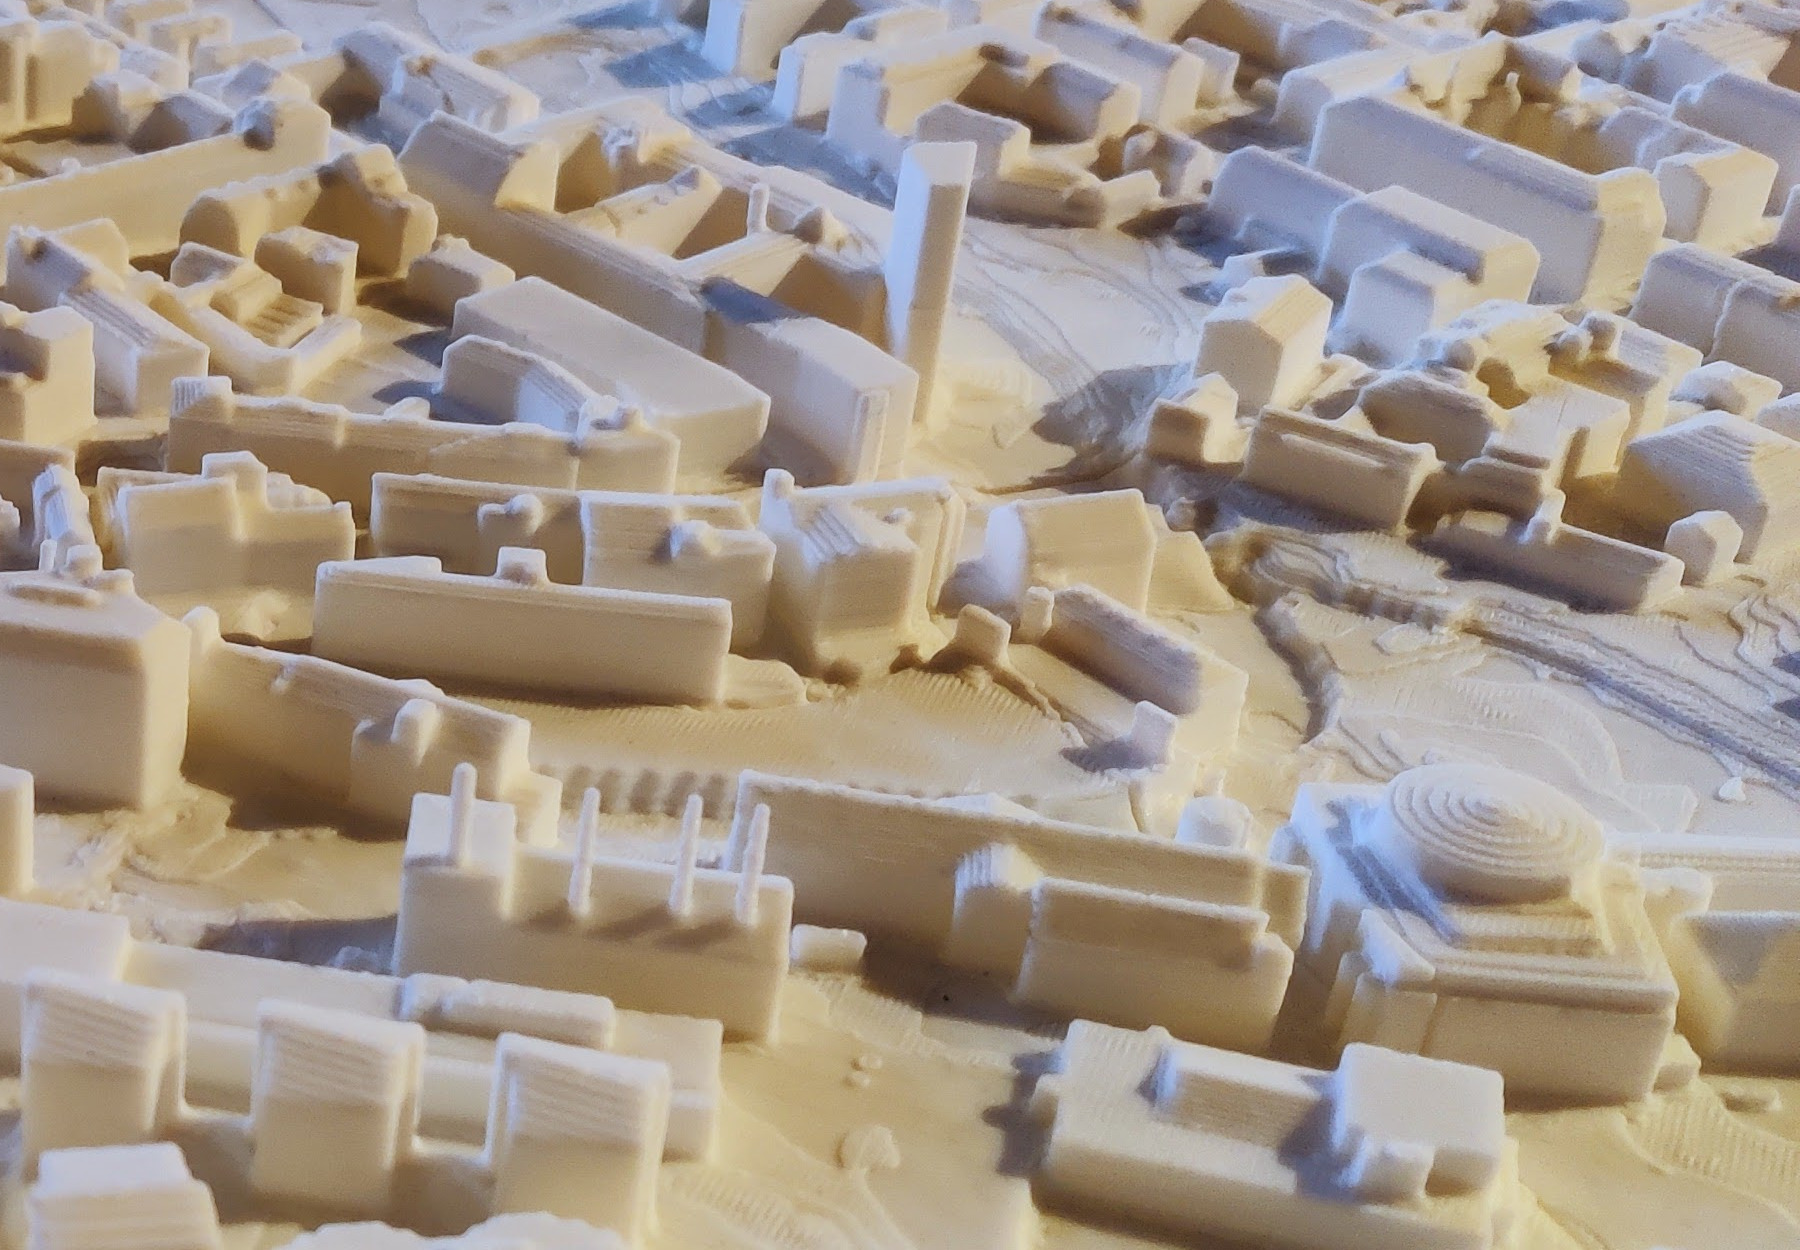
The physical 3D city model is the center of the exhibit. The model in Norrköping consists of 16x12 tiles printed in white PLA plastic. The same 3D city model is used virtually in the Unreal Engine application.
Read more about how we created the 3D model of Norrköping and how we printed it here:
Read more
Unreal Engine application
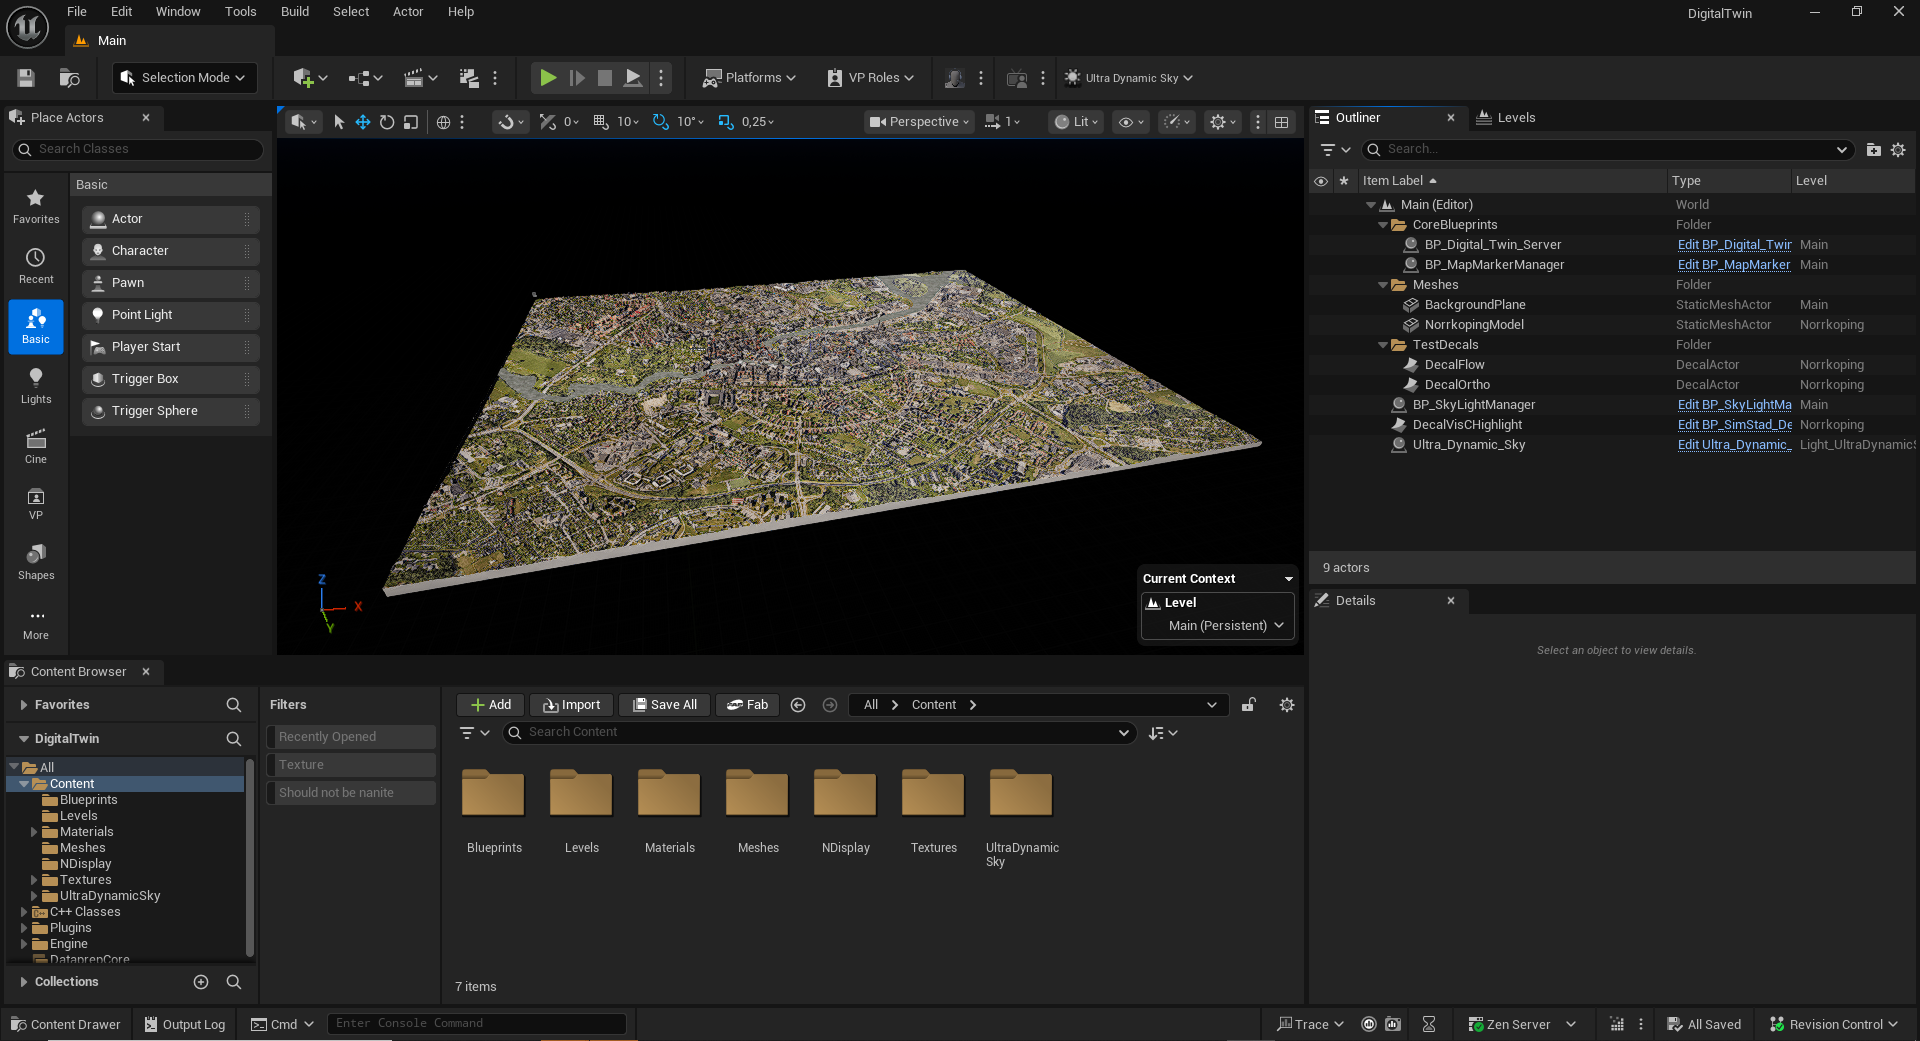
The Unreal Engine application is connected to the projectors and displays the map data onto the 3D print. It uses a copy of the 3D print model to simulate accyrate projections and realistic lighting.
Read more
Source code
User interface
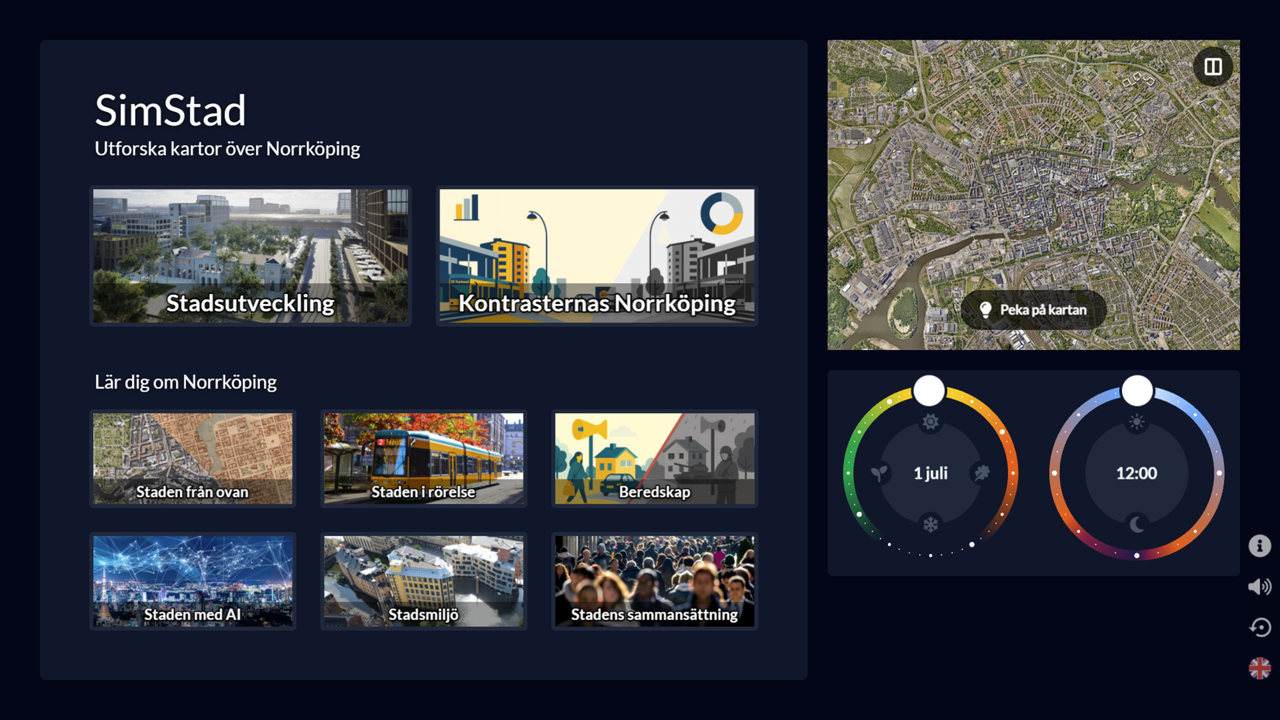
A clean, web-based control application allowing visitors or presenters to toggle specific datasets (such as flooding vectors or noise pollution mapping).
Read more
Source code
Pixilab Blocks
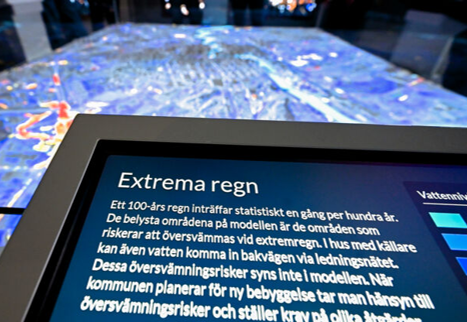
Surrounding the exhibit are additional displays. These are used to display data legends and supplimentary videos to make the exhibit more immersive. These displays are synchronized using Pixilab Blocks. The interface sends signals to Blocks, deciding what content to be shown.
Pixilab Blocks
Source code
Live-data and plug-ins
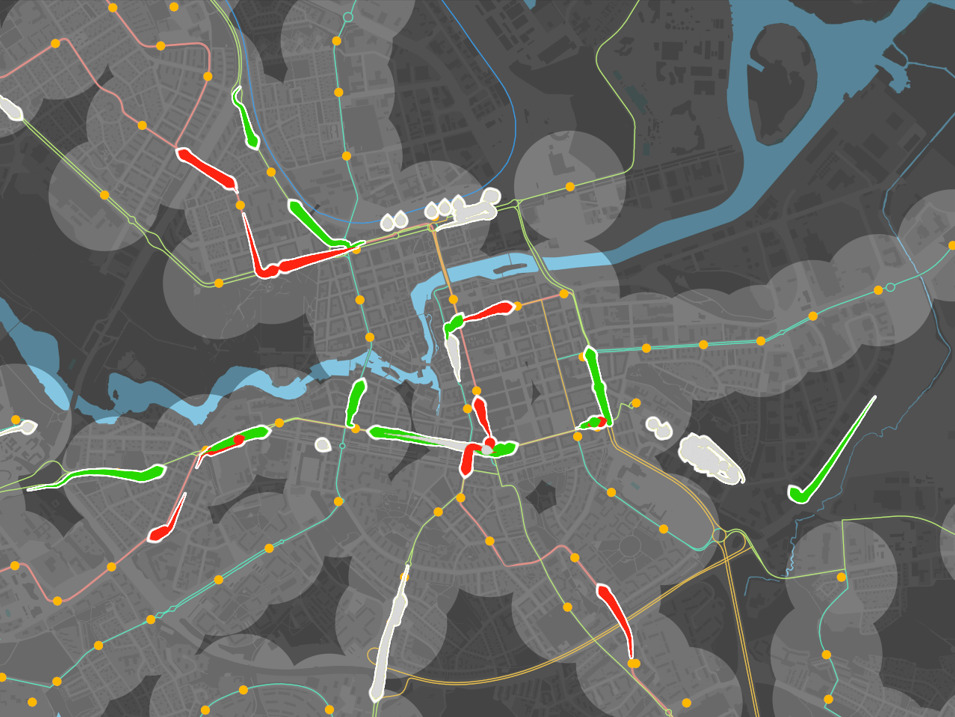
Modular pipeline additions that ingest external real-time data APIs (e.g., live municipal traffic feeds) and stream them straight into Unreal Engine via Network Device Interface (NDI) layers. Explore Live Data Plugins.
Read more
WebSocket Protocol
To make the installation modular and future-proof, the communication framework between the control interface, the Omni server, and the Unreal Engine rendering pipeline relies on a clean, message-driven network protocol. If your municipality wishes to replace the frontend, substitute the rendering stack, or add custom input hardware, you can hook straight into our defined WebSocket Protocol Guide.