
Technology Manager, Head of Unit
Erik Sundén
Head of Unit of Applied Visualization, Technology Manager at Norrköping Visualization Center C, and researcher/developer in immersive and interactive visualization.
Background
As a Unit Head of Applied Visualization @ LIU he manages a group of research engineers that together form the foundation work for many research and production projects within MIT/LIU/Visualization Center C.
As a Technology Manager at Norrköping Visualization Center C, Erik Sundén has overall responsibility for the installation, operation and maintenance of the technical infrastructure in the visualization environments, especially the dome theater and other environments focusing on virtual reality in the center. He is responsible for the C-Tech group, which consists of technical engineers and researchers who, among other things, conducts on-call technical support for the center.
Erik is also an active developer on most projects using the environments, and manages/engages in the development of open-source tools to make it easier for anyone to use the technologically advanced environments, with primary focus on real-time applications. He conducts various productions and research projects in the field of immersive visualization, with the aim of lifting the center's range of applications and enhance the inspiration of visualization and science for the center's visitors.
Erik has a M.S. degree in Media Technology from Linköping University since 2010.
Projects
TellUs
2025 — ongoing
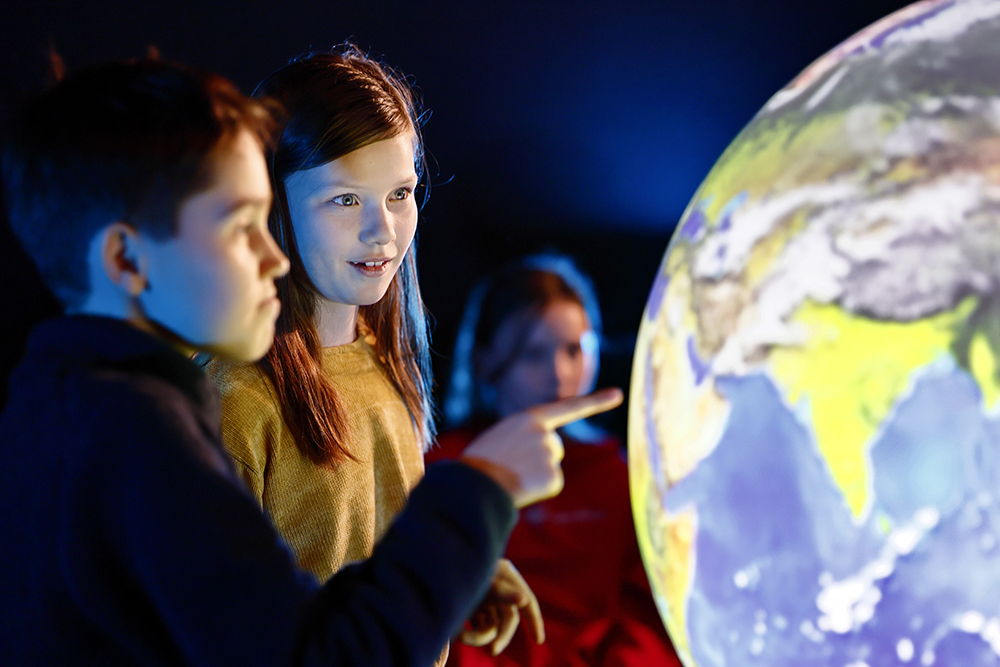
An interactive visualization globe utilizing AI to engage primary students in STEM through conversational exploration of Earth and space data.
C-Play : Immersive Media Player
2021 — ongoing
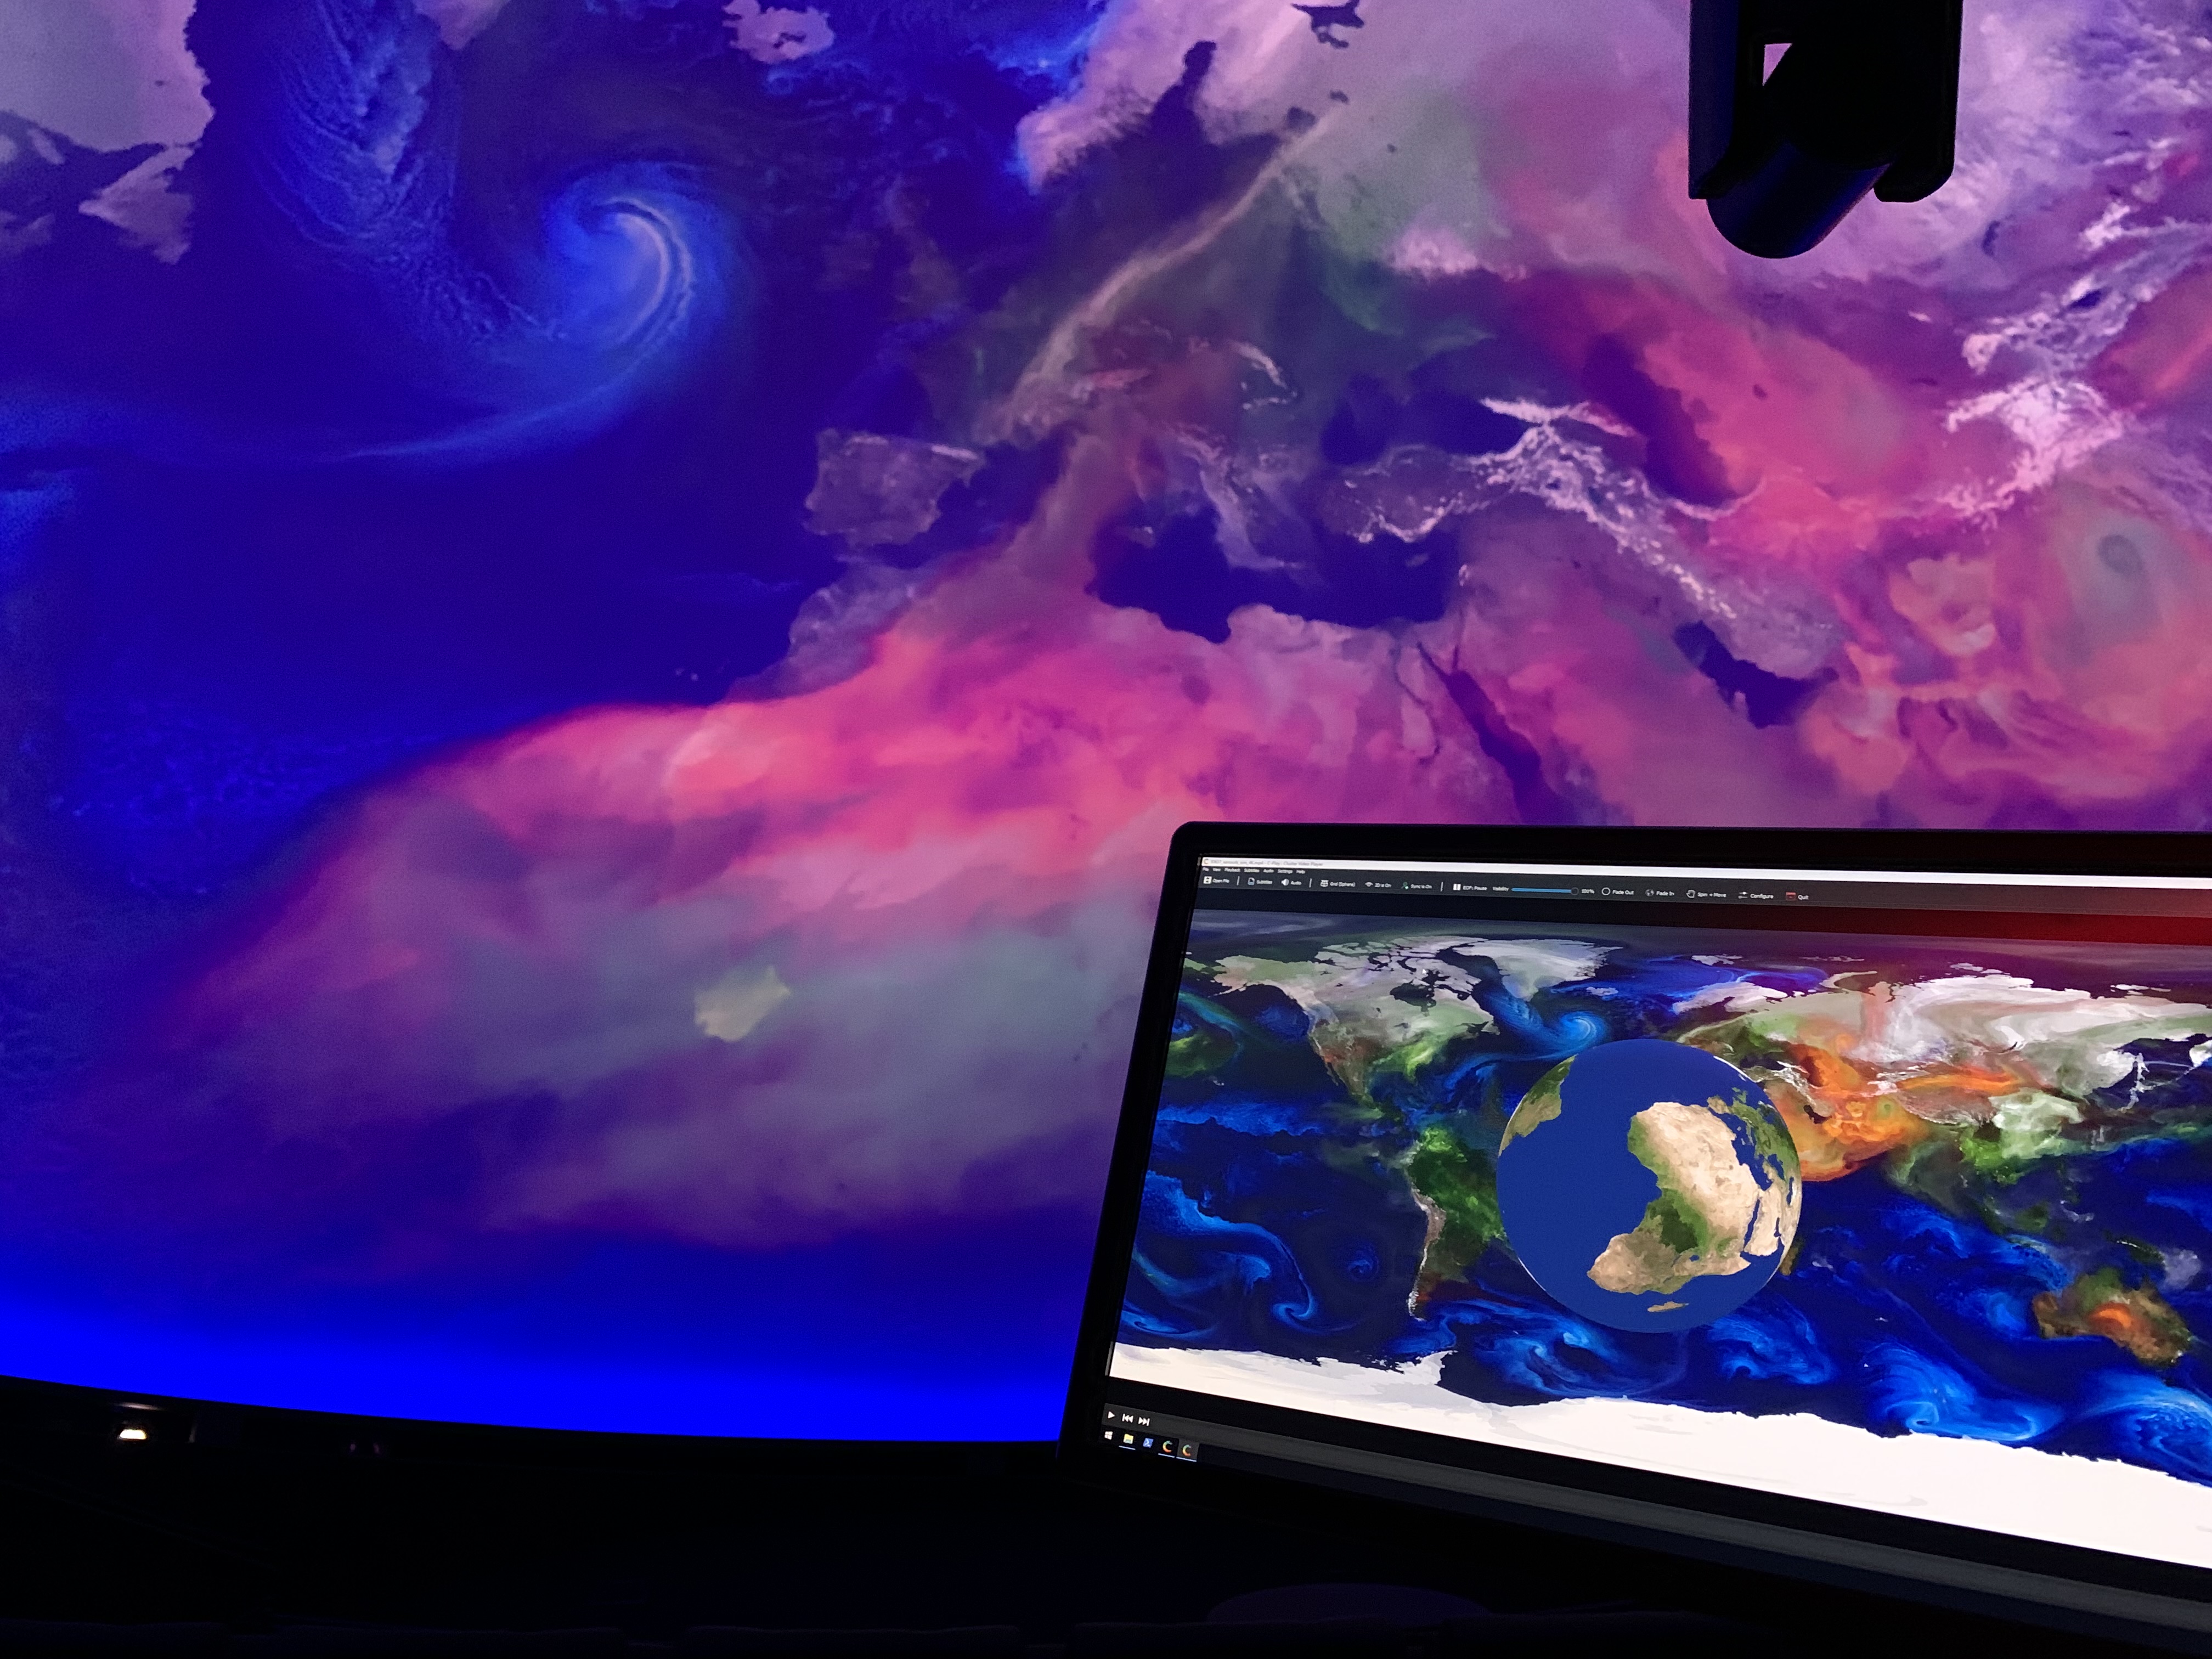
A versatile media player for cluster environments, enabling synchronized playback of immersive formats like 360°, fisheye, and stereoscopic video.
SimStad
2022 — 2026
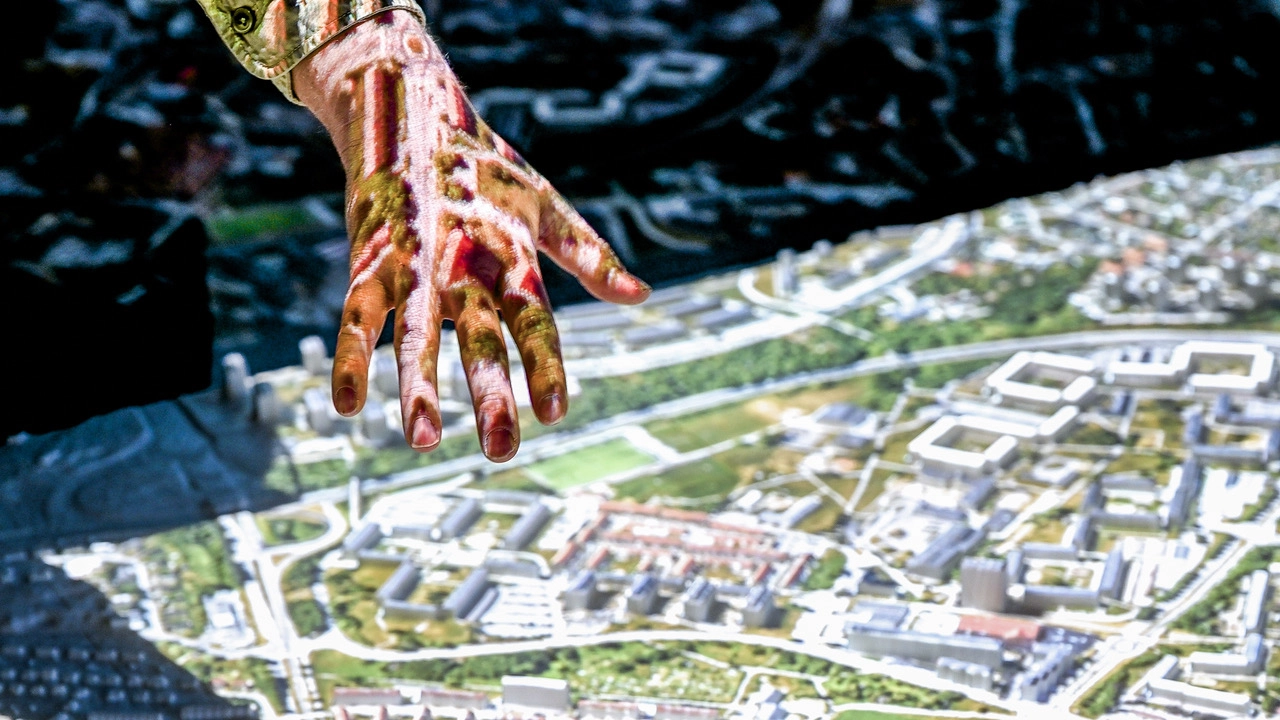
An urban planning platform and digital twin using AI to visualize city data for maintenance, simulation, and public outreach.
Getinge Dome Production
2023
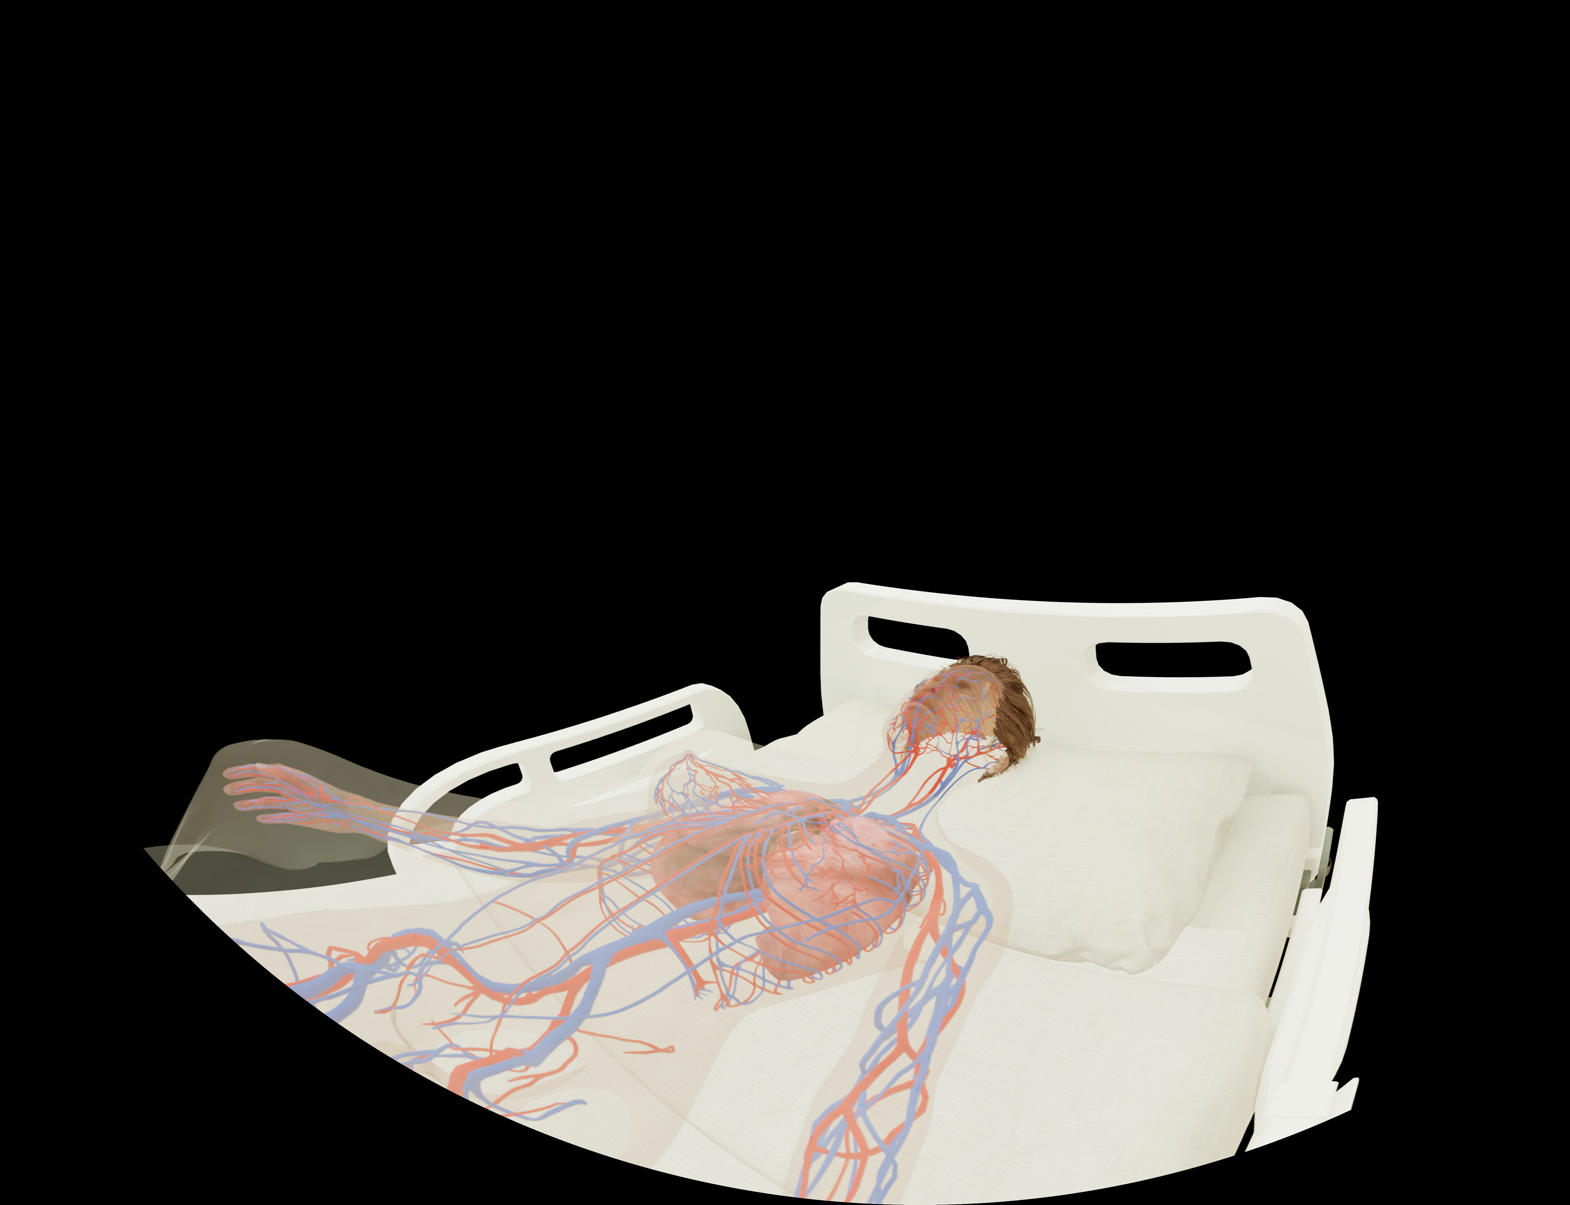
A collaborative project between Linköping University and Getinge creating immersive 8K dome movies to showcase medical technology products.
Artificial Architect
2022 — 2023
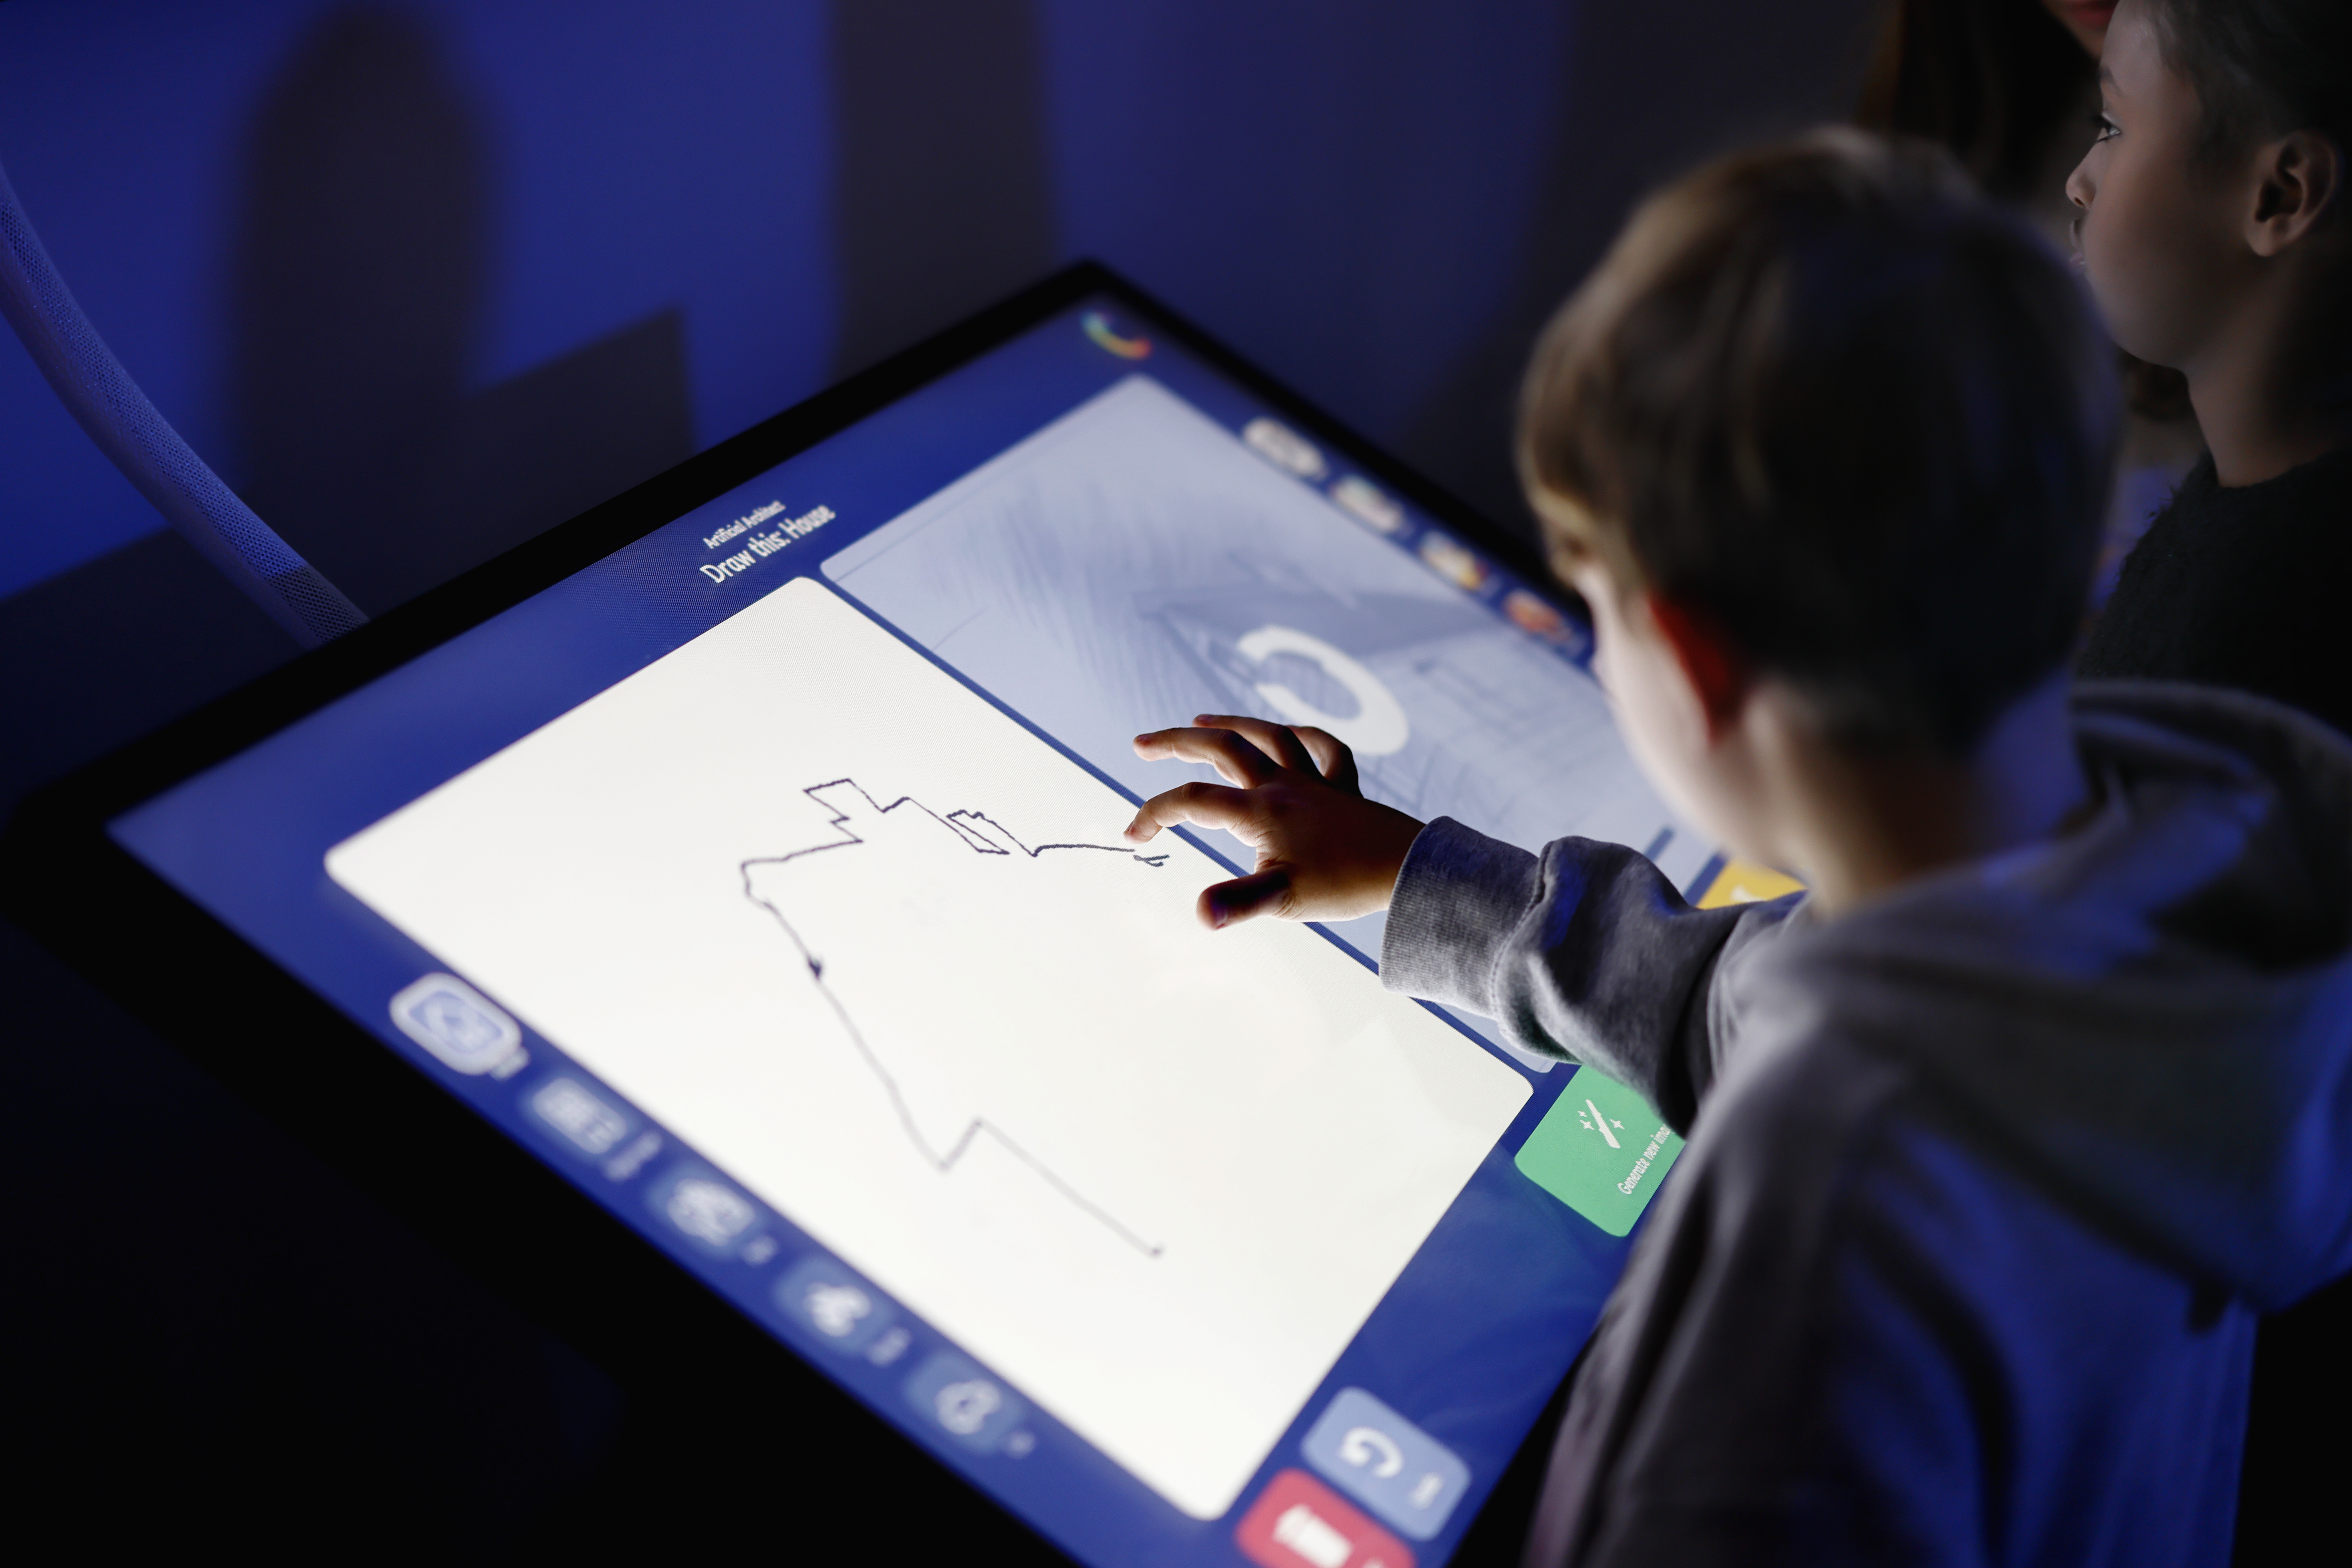
An interactive installation showcasing generative AI, where visitors use text prompts and sketches to instantly co-create architectural concepts with Stable Diffusion.
The Globe
2021 — 2022
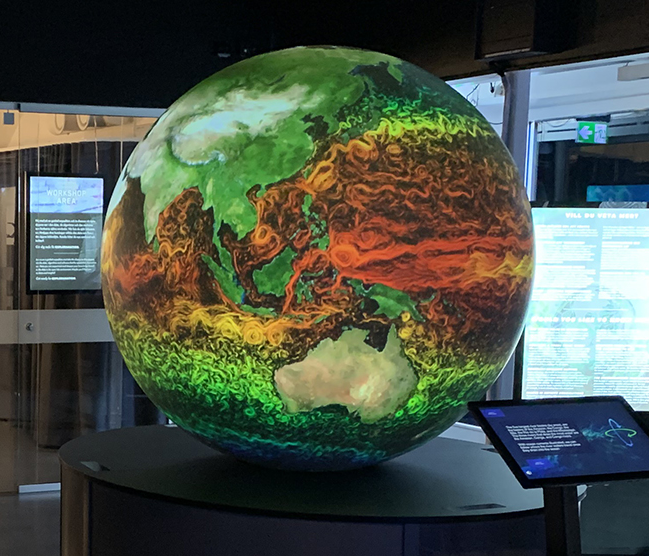
An interactive ecological simulation exploring biodiversity and species interdependence through real-time food web modeling and scientific data.
Guides
SimStad
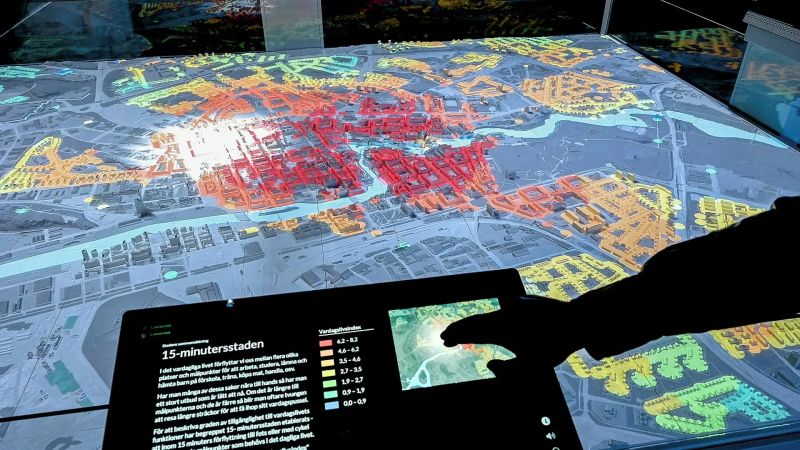
A technical guide for SimStad, an interactive urban exhibition system combining physical 3D prints, spatial projection mapping, and web-controlled digital twins.
Slicer Tool
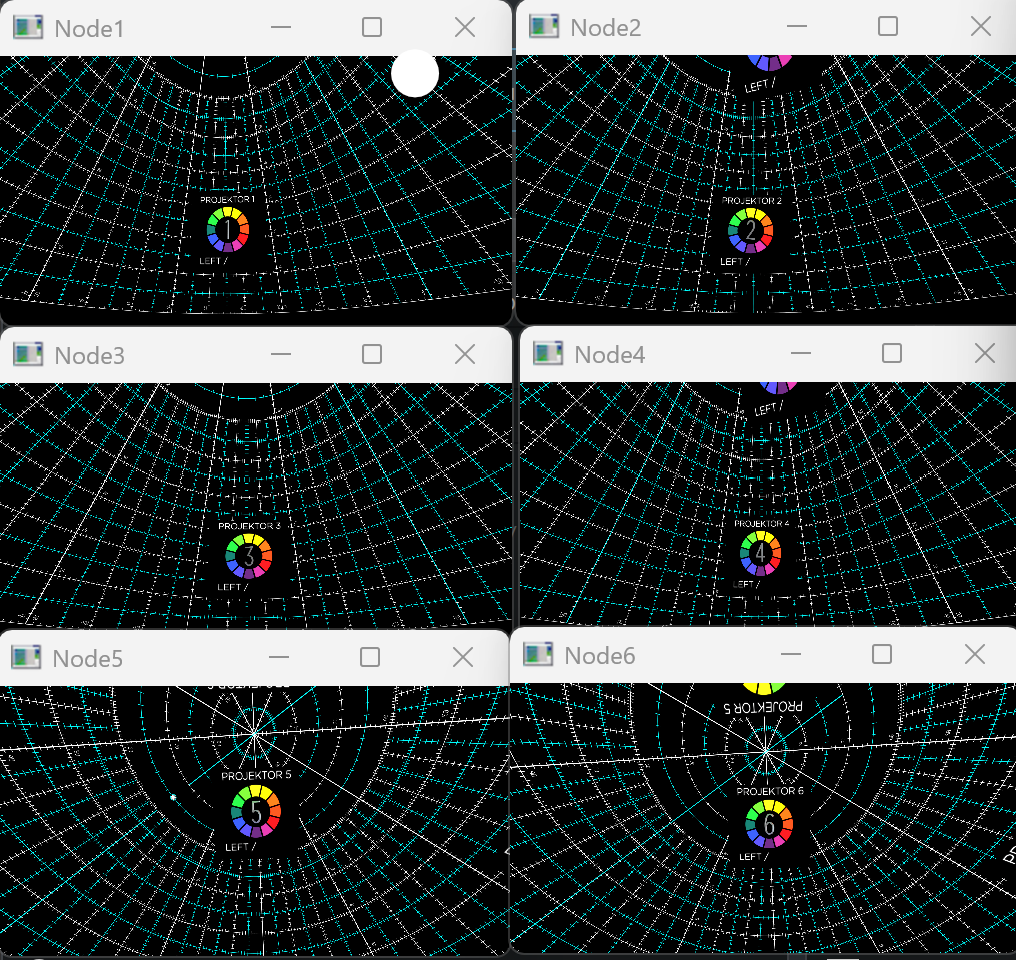
Media encoder for preparing image sequences and video files for immersive playback systems
Stitcher Tool
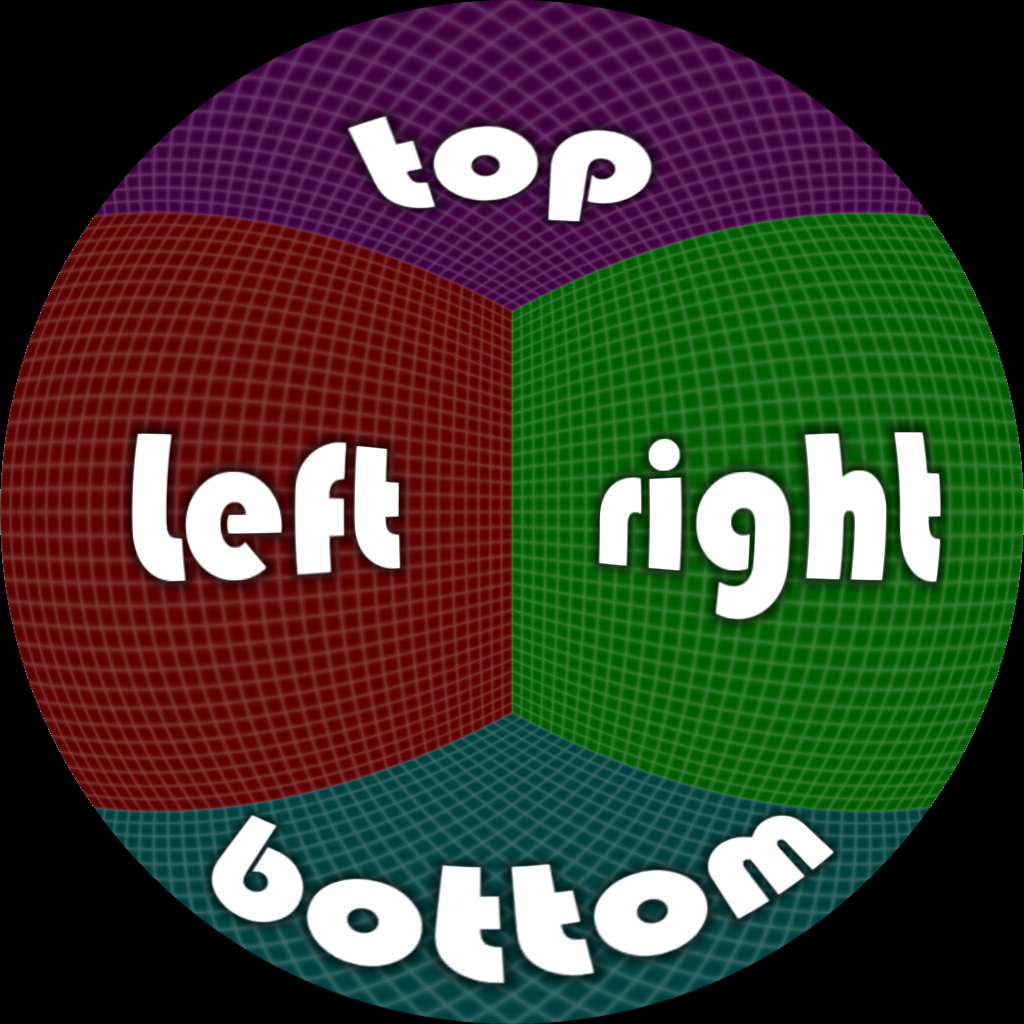
Tool for stitching together images into fisheye frames
Publications
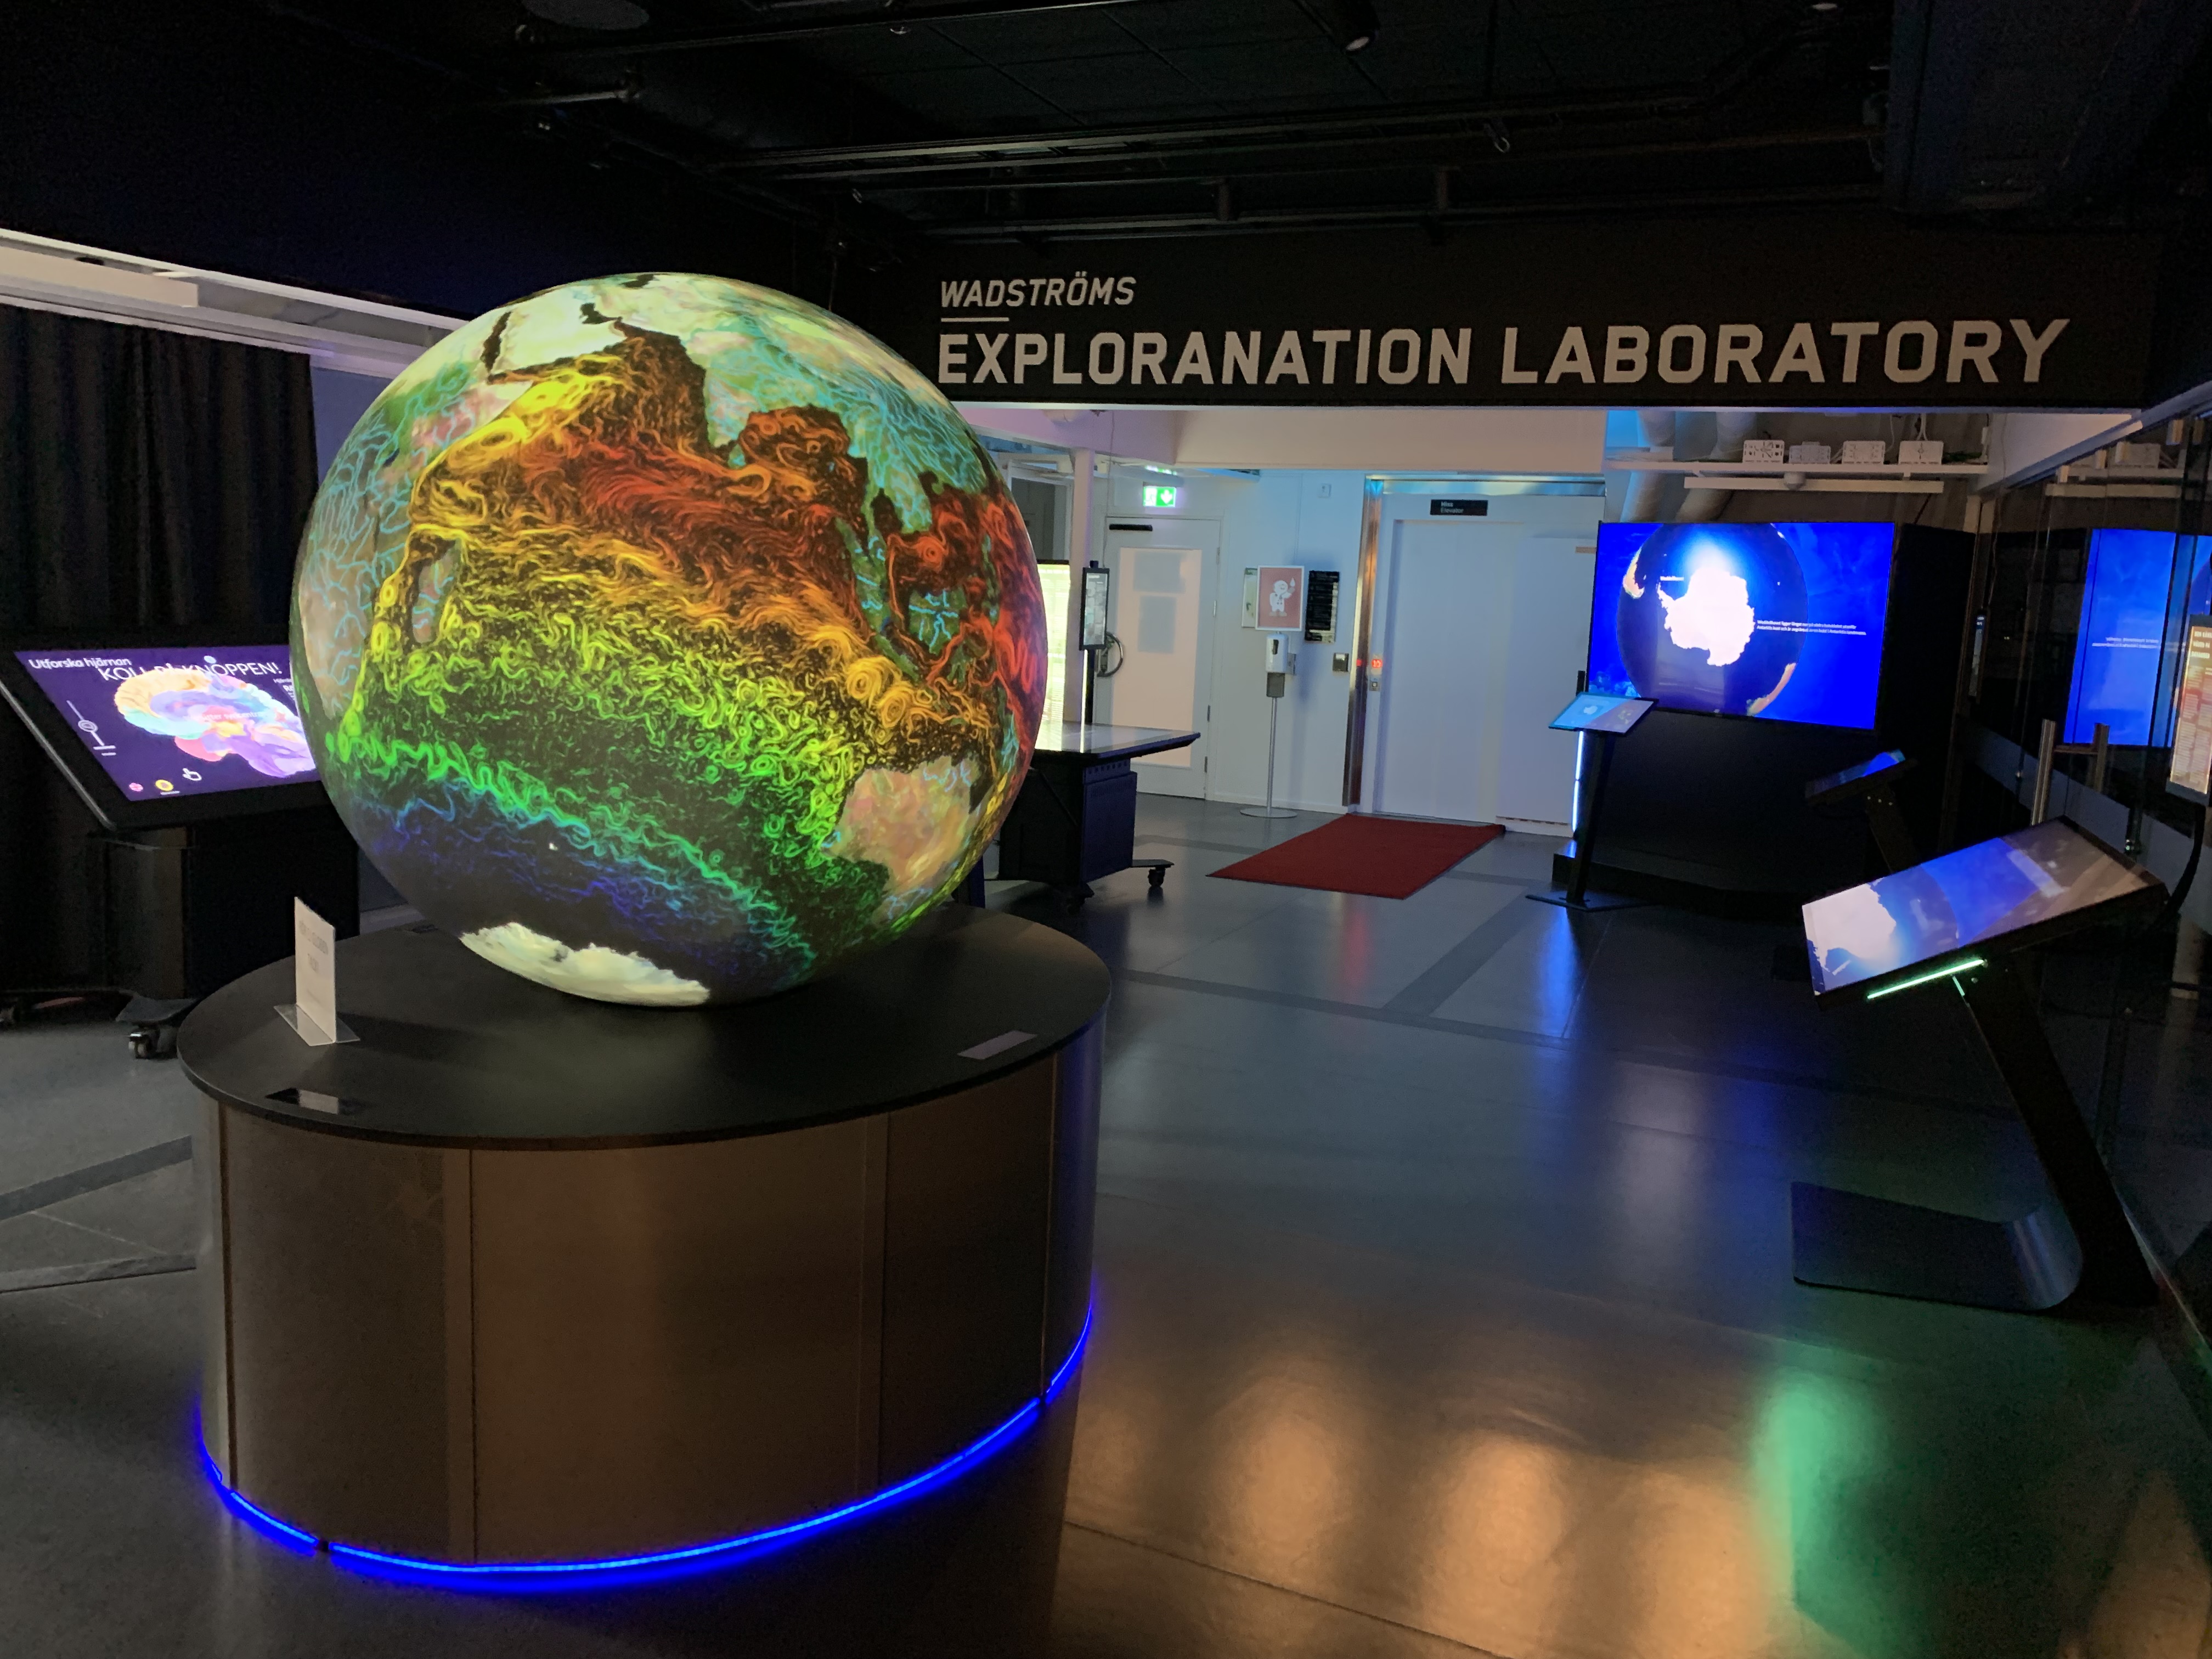
Exploring and Explaining Climate Change: Exploranation as a Visualization Pedagogy for Societal Action
L. Besançon, K. Schönborn, E. Sundén, Y. He, S. Rising, P. Westerdahl, P. Ljung, J. Wideström, C. Hansen, A. Ynnerman, I. Hotz, T. Ropinski
VIS4GOOD, a workshop on Visualization for Social Good, part of IEEE VIS, 2022
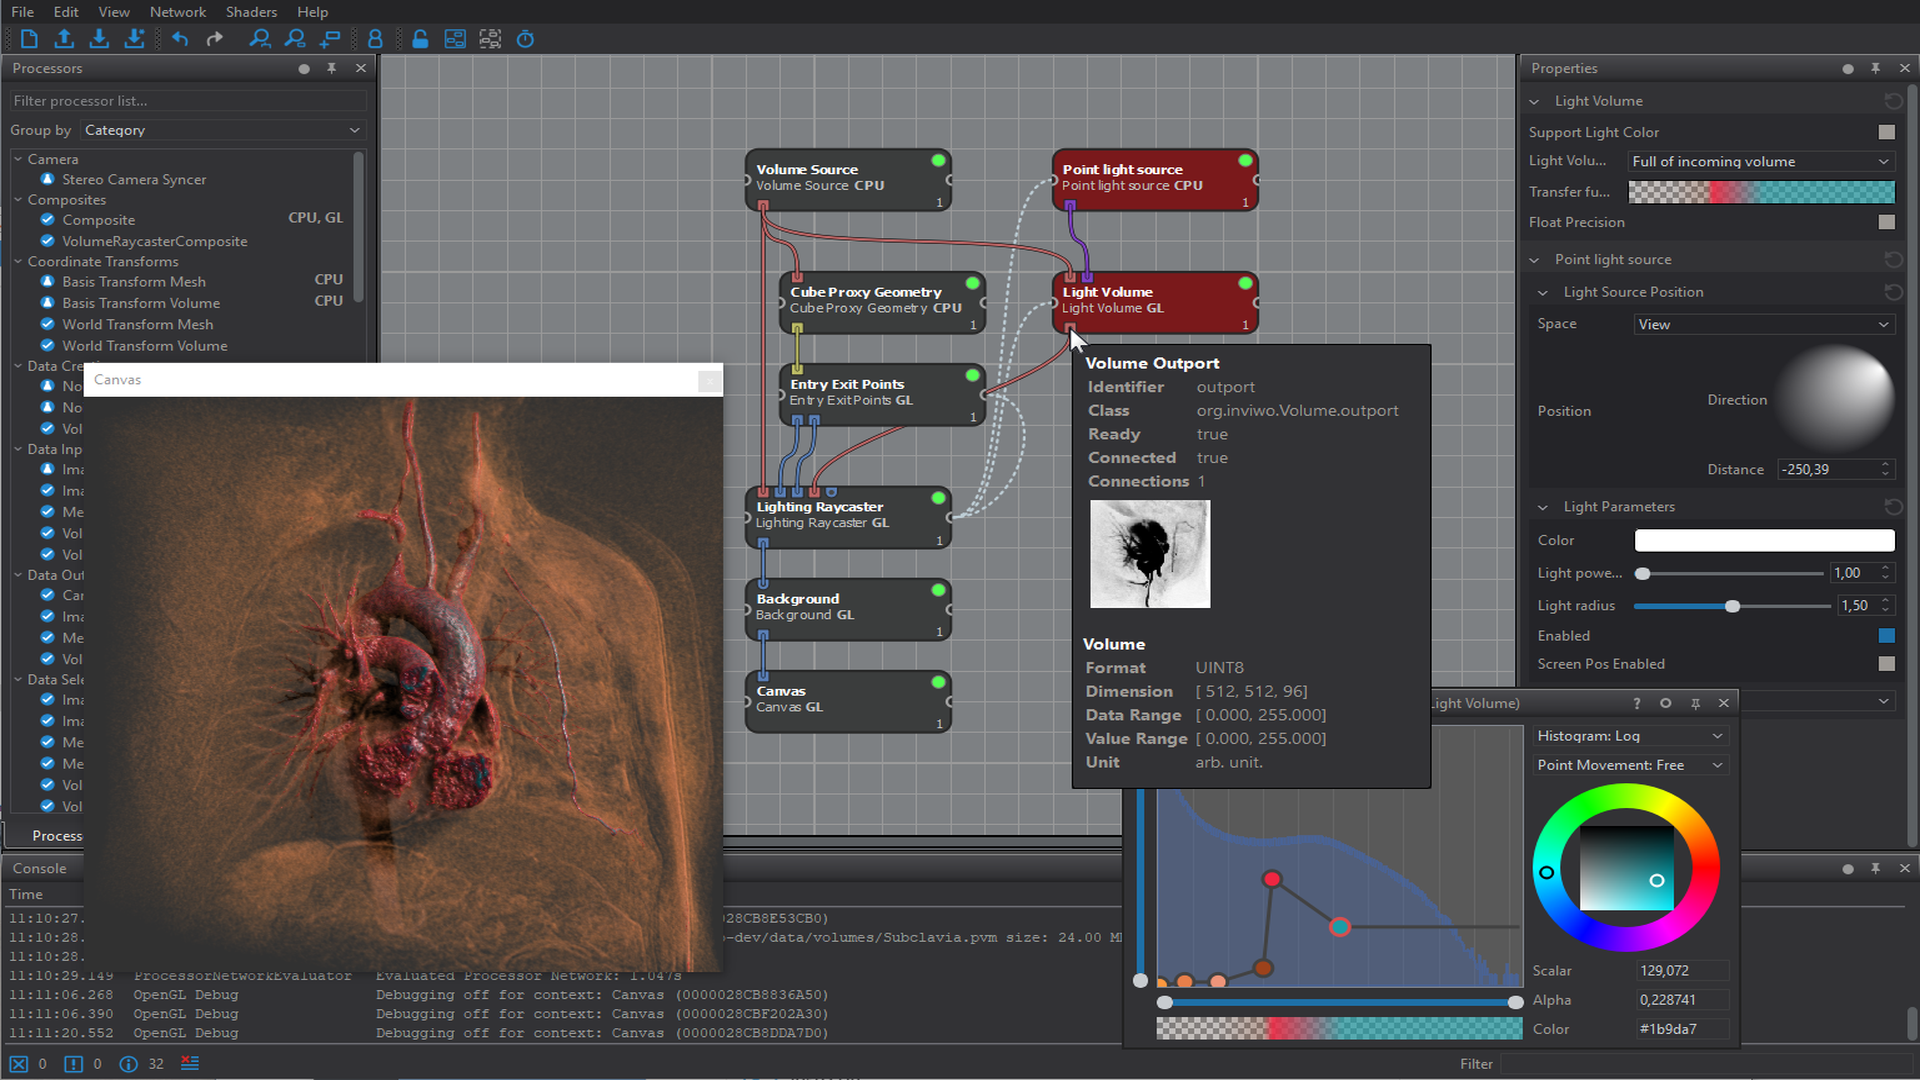
Inviwo — A Visualization System with Usage Abstraction Levels
D. Jönsson, P. Steneteg, E. Sundén, R. Englund, S. Kottravel, M. Falk, A. Ynnerman, I. Hotz, T. Ropinski
IEEE Transactions on Visualization and Computer Graphics, 2019
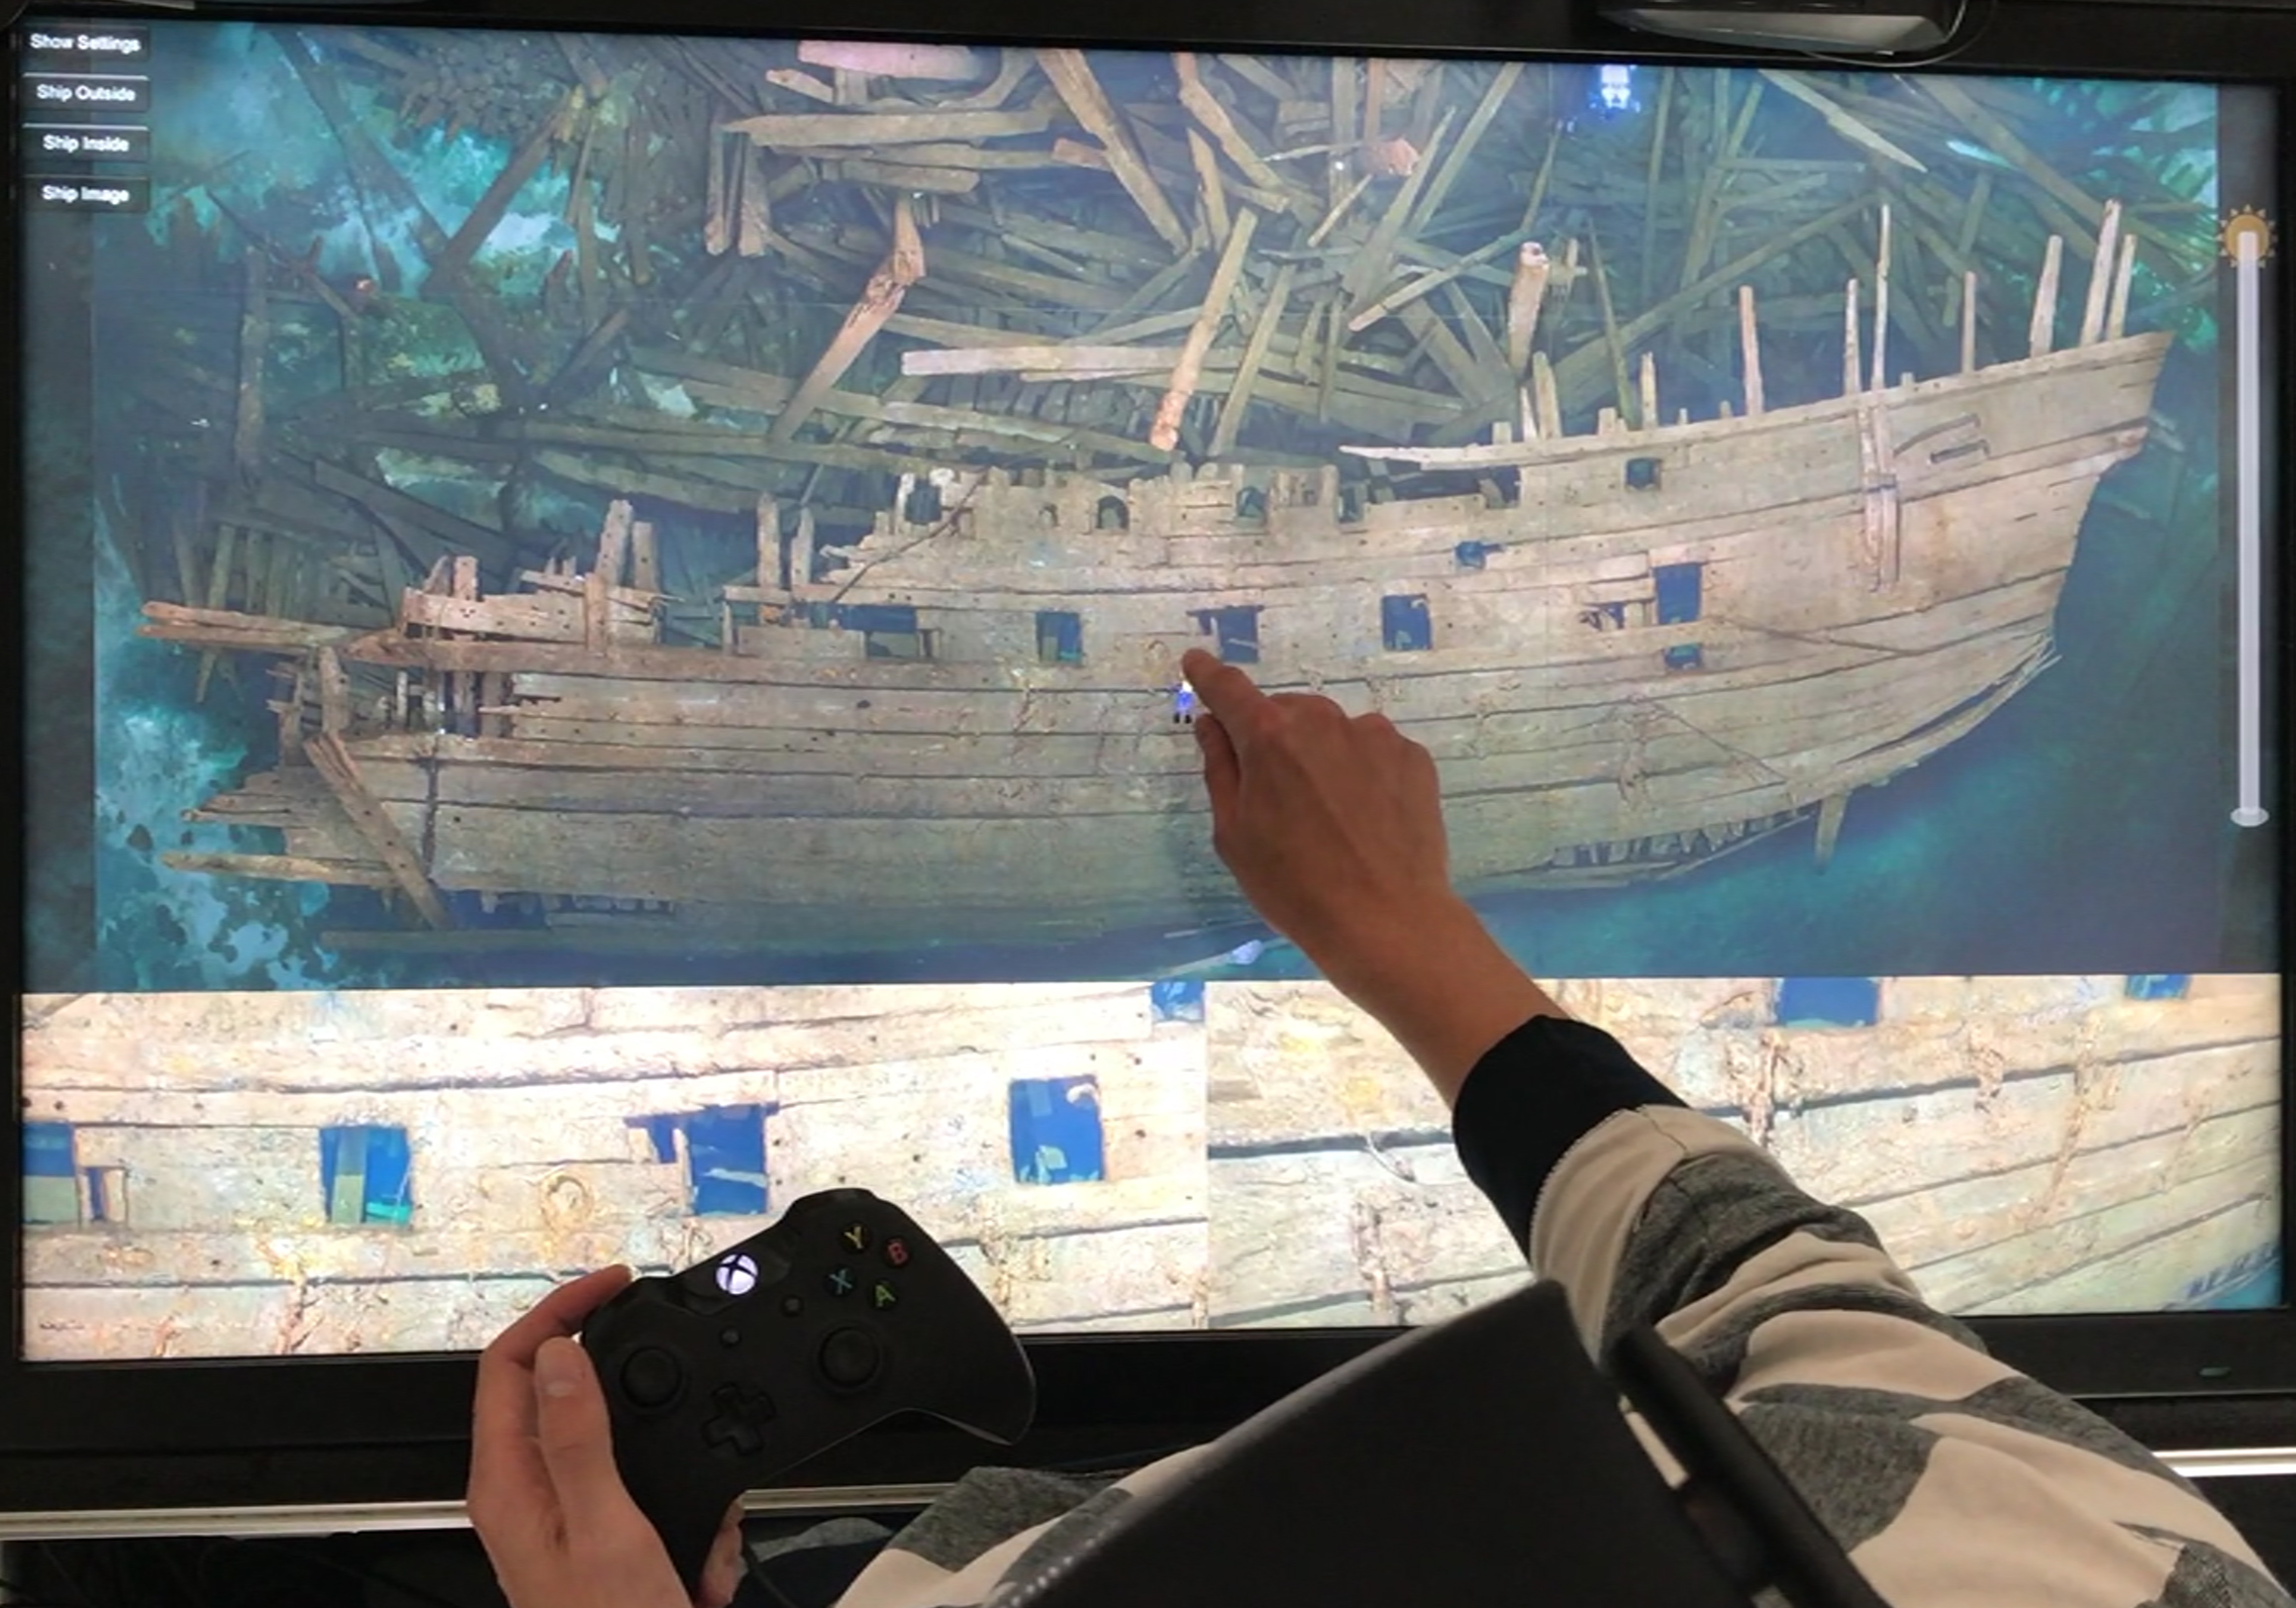
Hybrid Virtual Reality Touch Table - An Immersive Collaborative Platform for Public Explanatory Use of Cultural Objects and Sites
E. Sundén, I. Lungren, A. Ynnerman
Eurographics Workshop on Graphics and Cultural Heritage, 2017
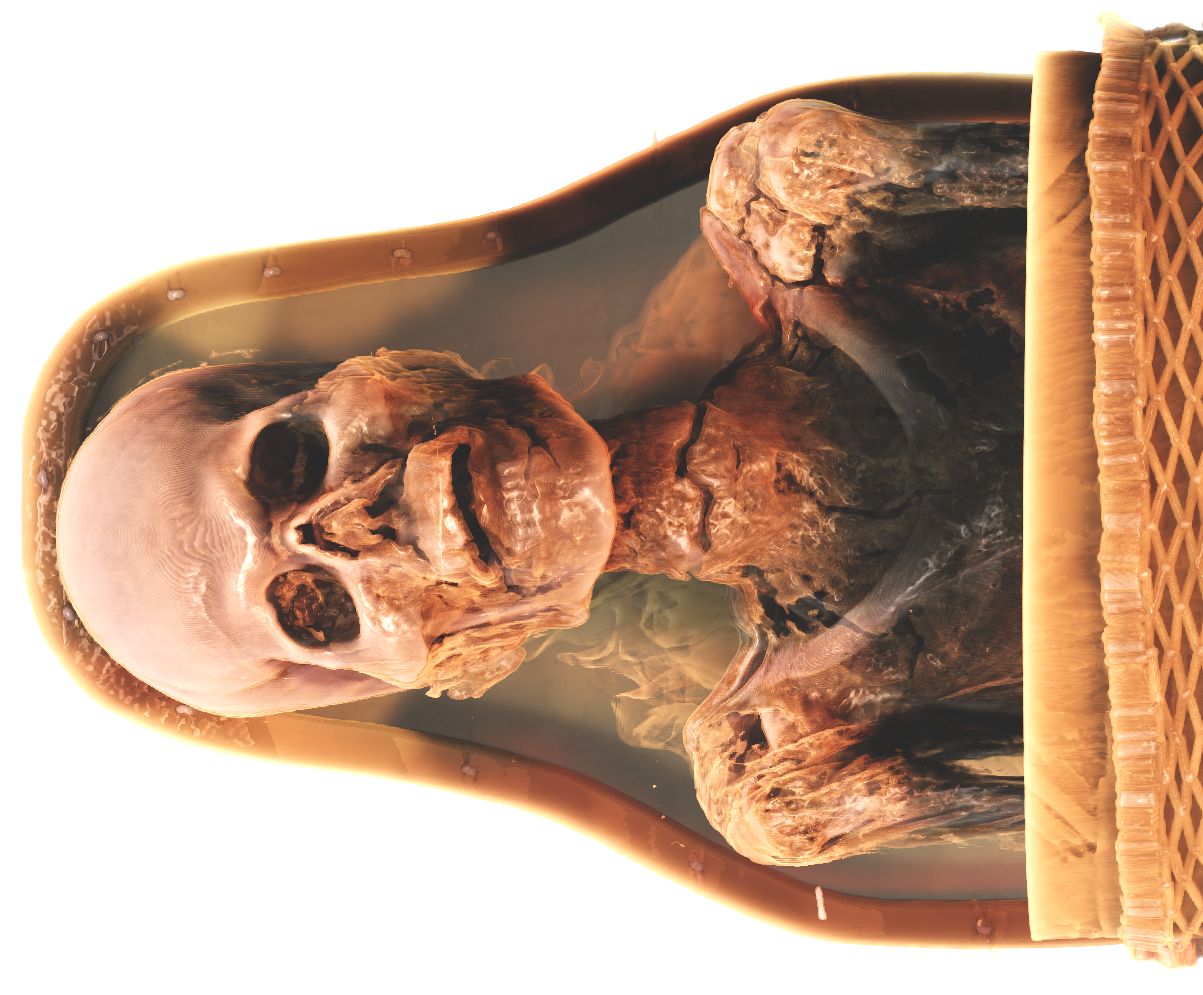
Efficient volume illumination with multiple light sources through selective light updates
E.Sundén, T.Ropinski
IEEE Pacific Visualization Symposium (PacificVis), 2015
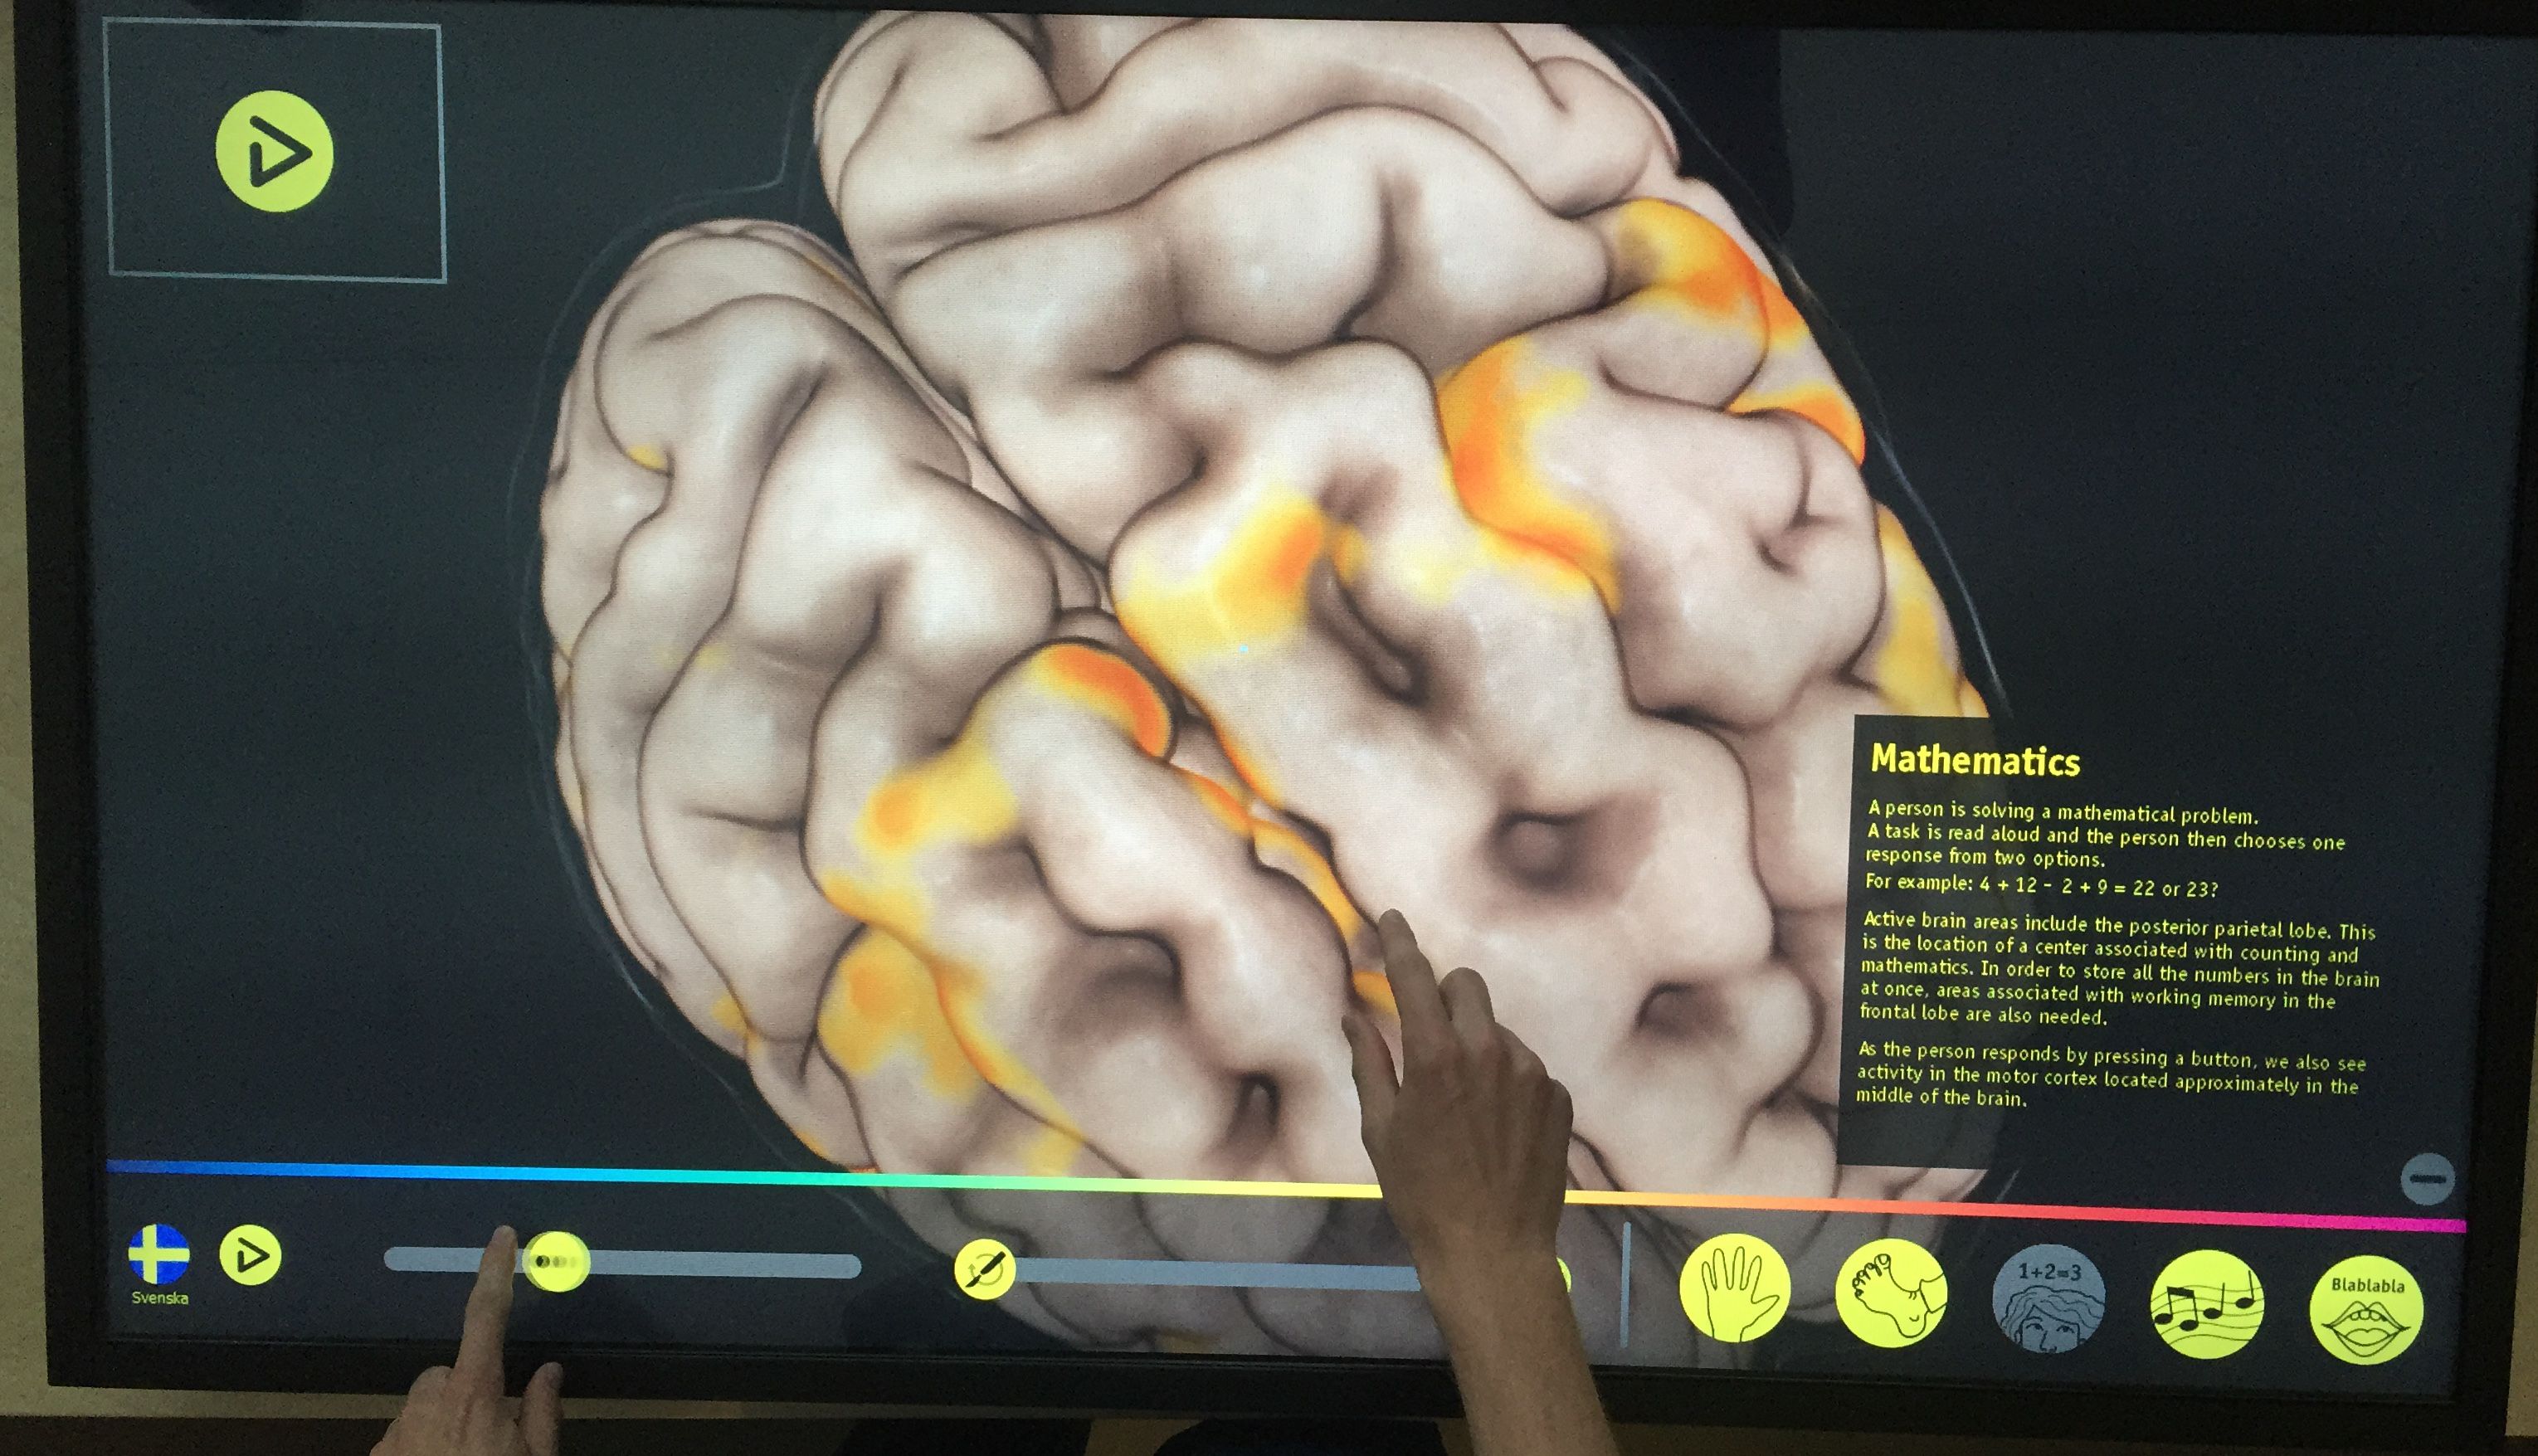
Inviwo - An extensible, multi-purpose visualization framework
E. Sundén, P. Steneteg, S. Kottravel, D. Jönsson, R. Englund, M. Falk, T. Ropinski
IEEE Scientific Visualization Conference, 2015
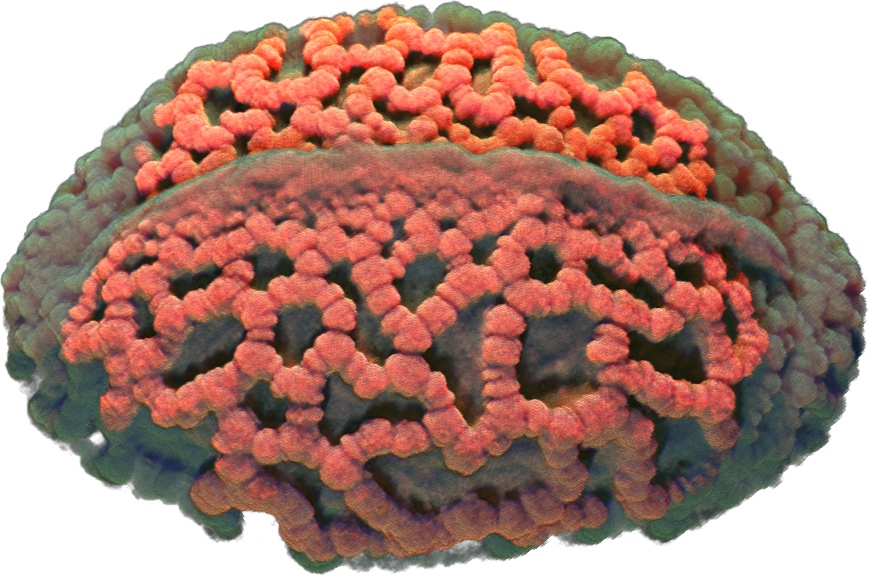
Multimodal Volume Illumination
E. Sundén, S. Kottravel, T. Ropinski
Computer Graphics Forum, 2015
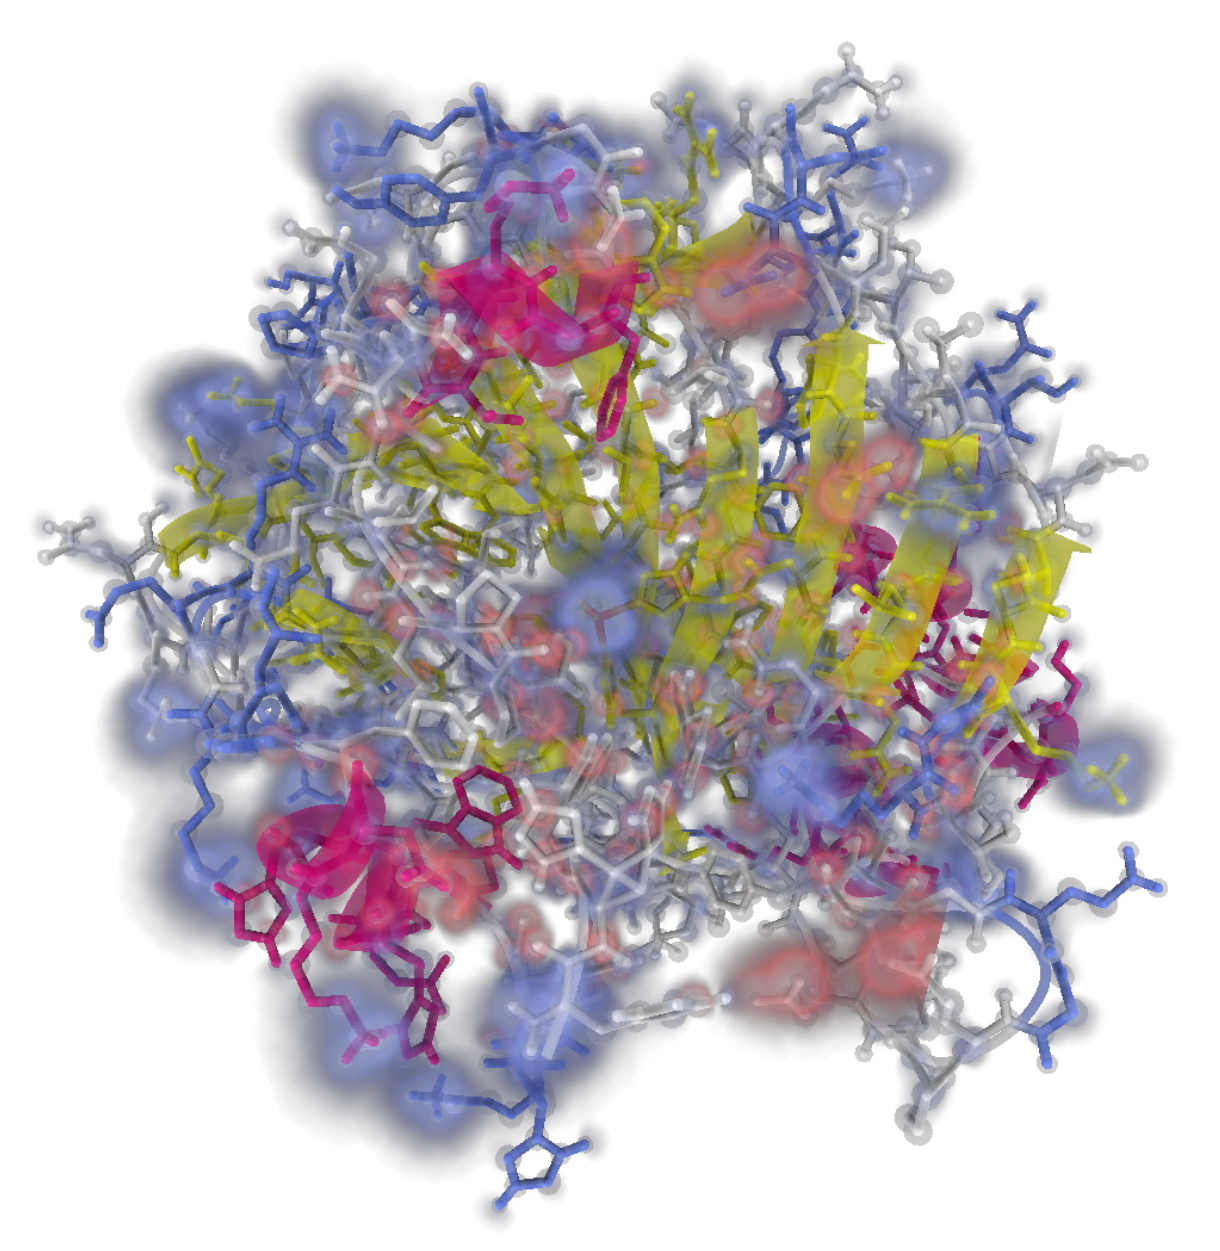
Hybrid Data Visualization Based On Depth Complexity Histogram Analysis
S. Lindholm, M. Falk, E. Sundén, A. Bock, A. Ynnerman, T. Ropinski
Computer Graphics Forum, 2015
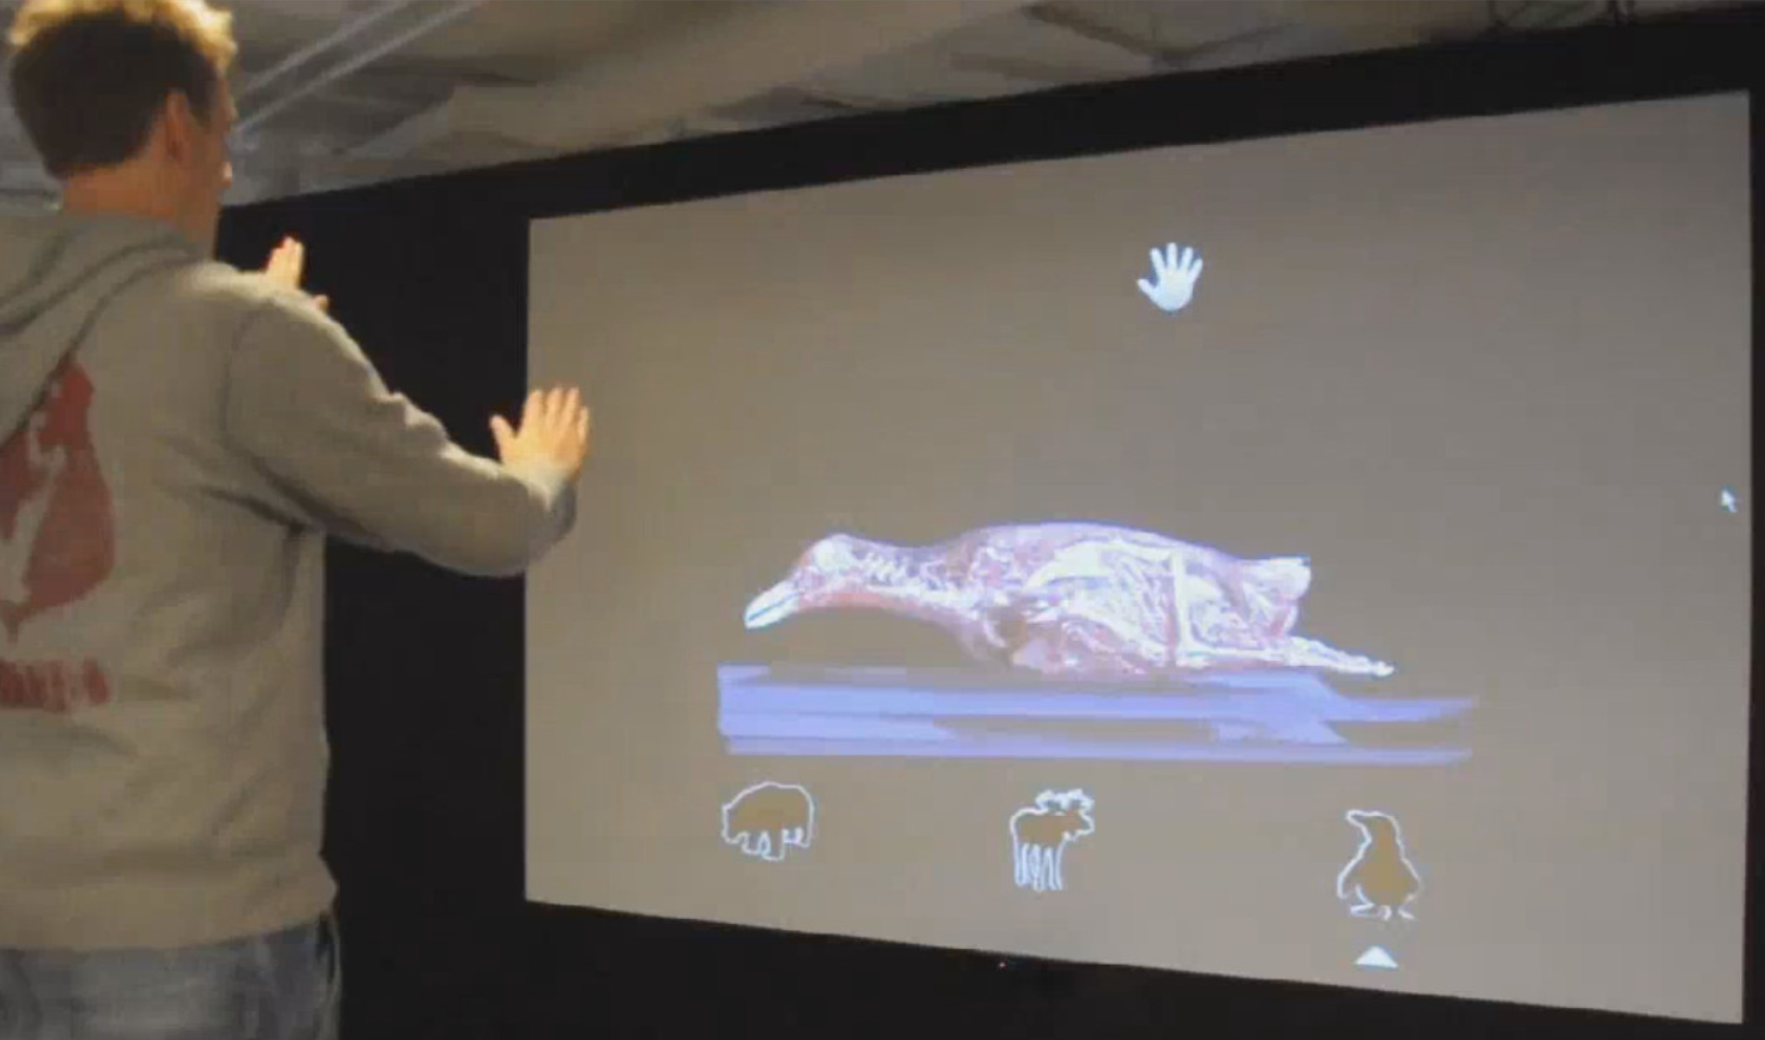
Interaction Techniques as a Communication Channel when Presenting 3D Visualizations
E. Sundén, A. Bock, D. Jönsson, A. Ynnerman, T. Ropinski
IEEE VIS International Workshop on 3DVis, 2014
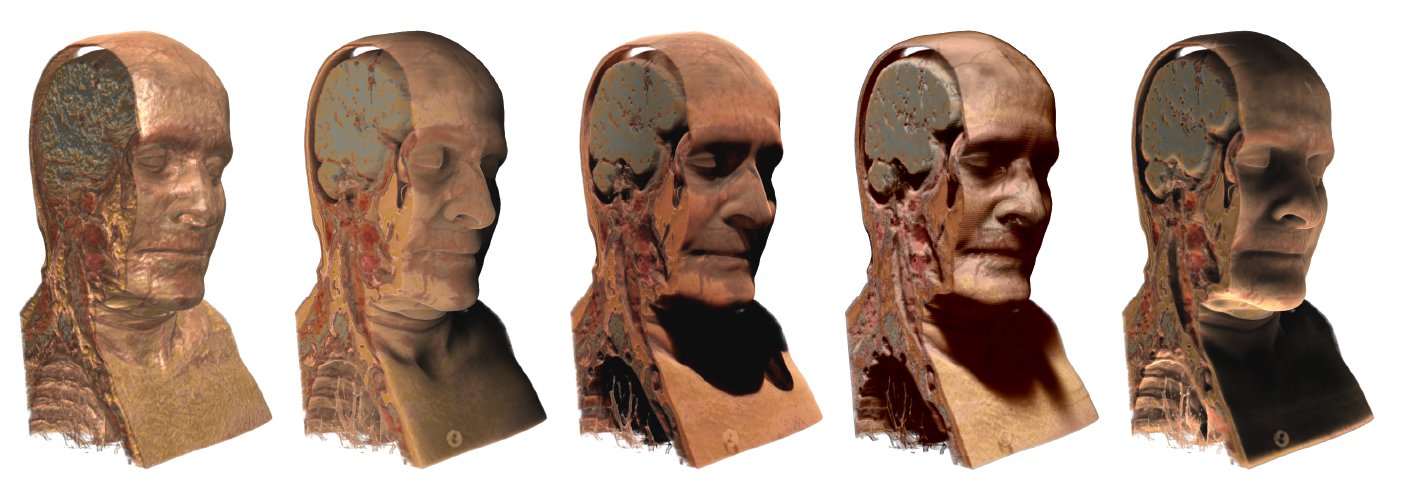
A Survey of Volumetric Illumination Techniques for Interactive Volume Rendering
D. Jönsson, E. Sundén, A. Ynnerman, T. Ropinski
Computer Graphics Forum, 2014
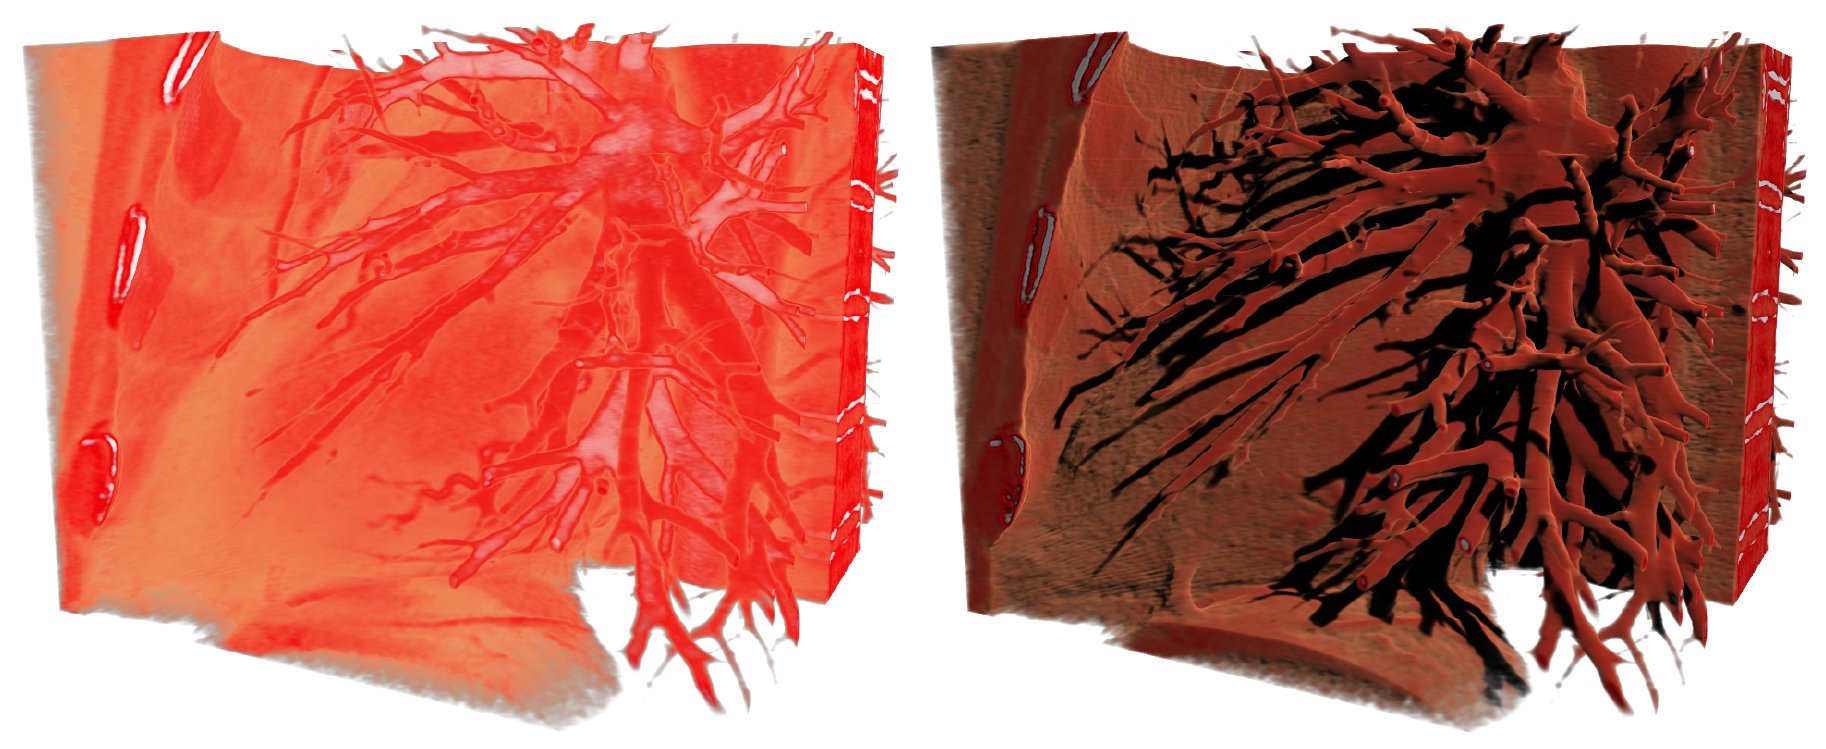
Interactive Volume Rendering with Volumetric Illumination
D. Jönsson, E. Sundén, A. Ynnerman, T. Ropinski
Eurographics 2012 - State of the Art Reports, 2012
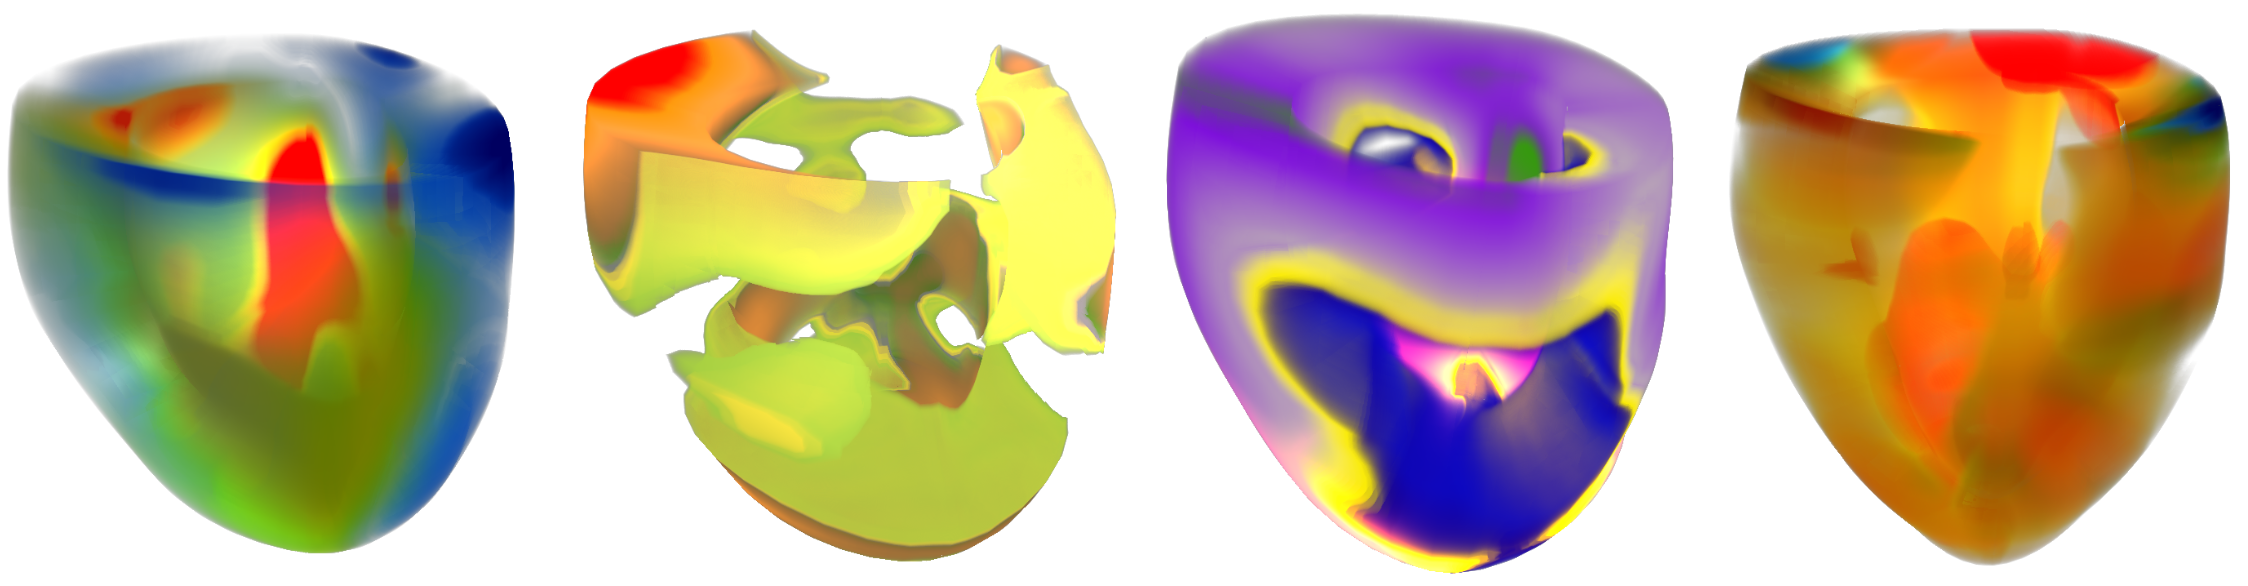
Coherency-Based Curve Compression for High-Order Finite Element Model Visualization
A. Bock, E. Sundén, L. Bingchen, B. Wuensche, T. Ropinski
IEEE Transactions on Visualization and Computer Graphics, 2012
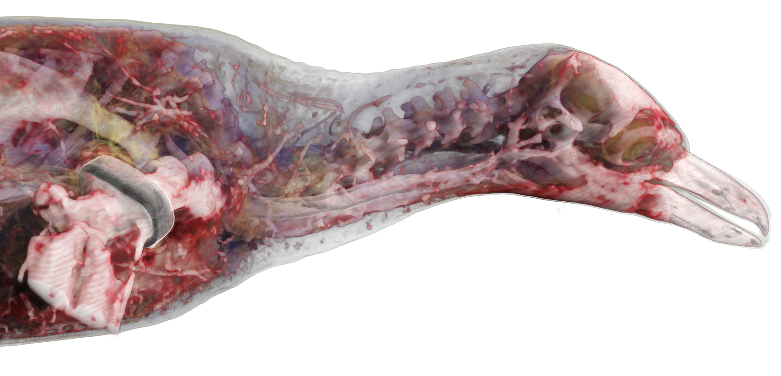
Image Plane Sweep Volume Illumination
E. Sundén, A. Ynnerman, T. Ropinski
IEEE Transactions on Visualization and Computer Graphics, 2011
Spaces
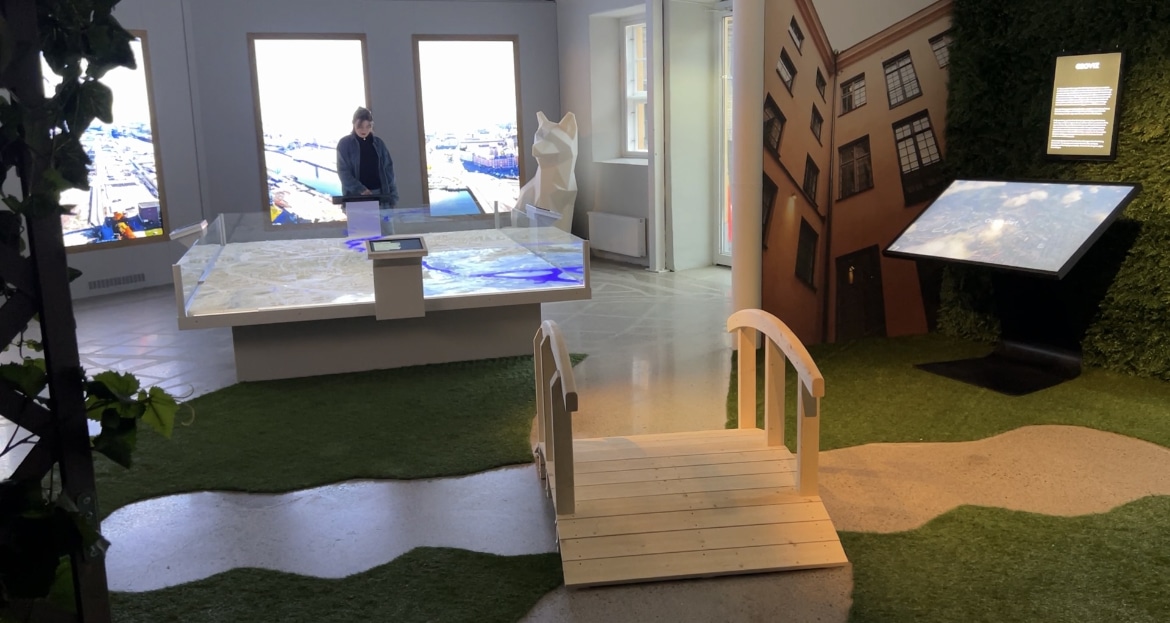
Visual City
2023
An interactive lab at Visualiseringscenter C showcasing urban development through AI, computer vision, and a digital twin of Norrköping.
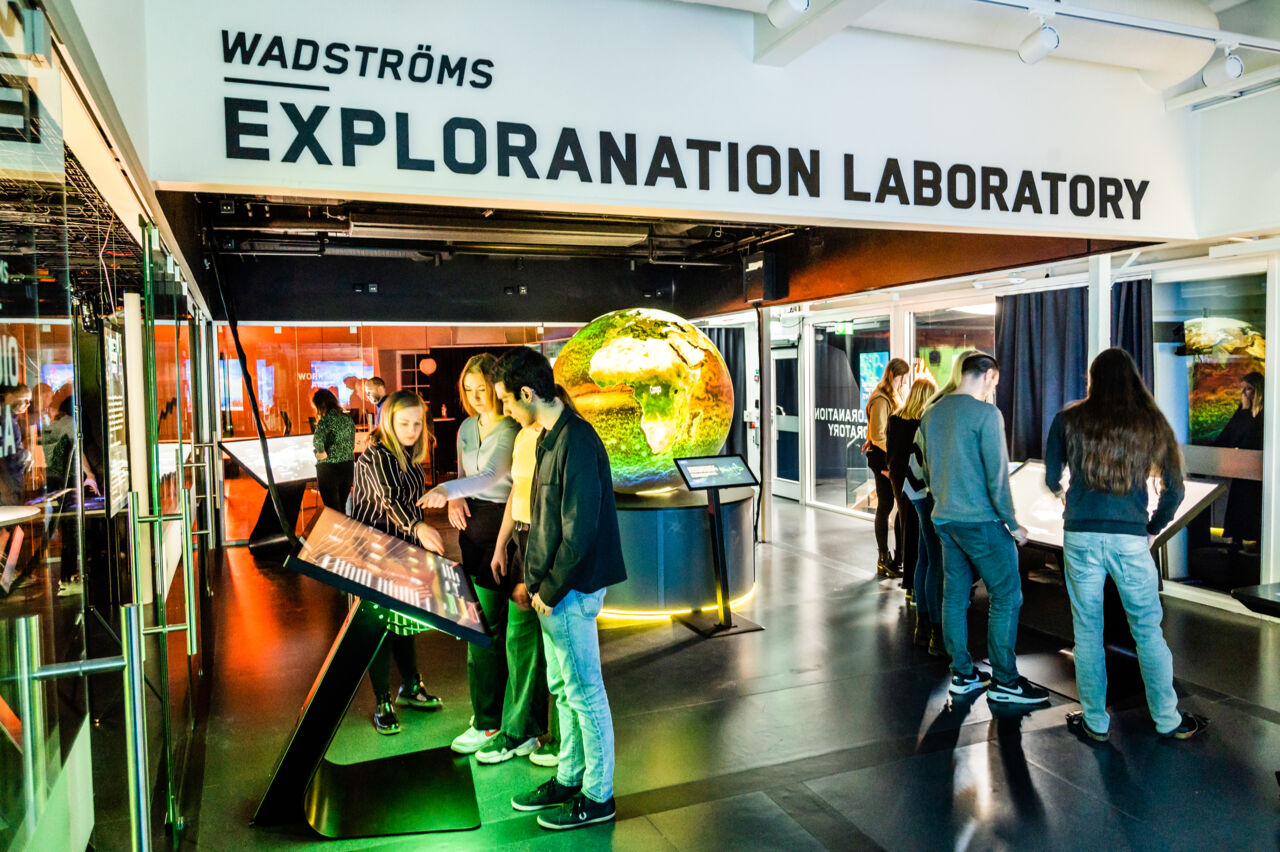
Wadströms Exploranation Laboratory
2021
A Linköping University lab at Visualization Center C blending exploration and explanation to research global sustainability datasets.
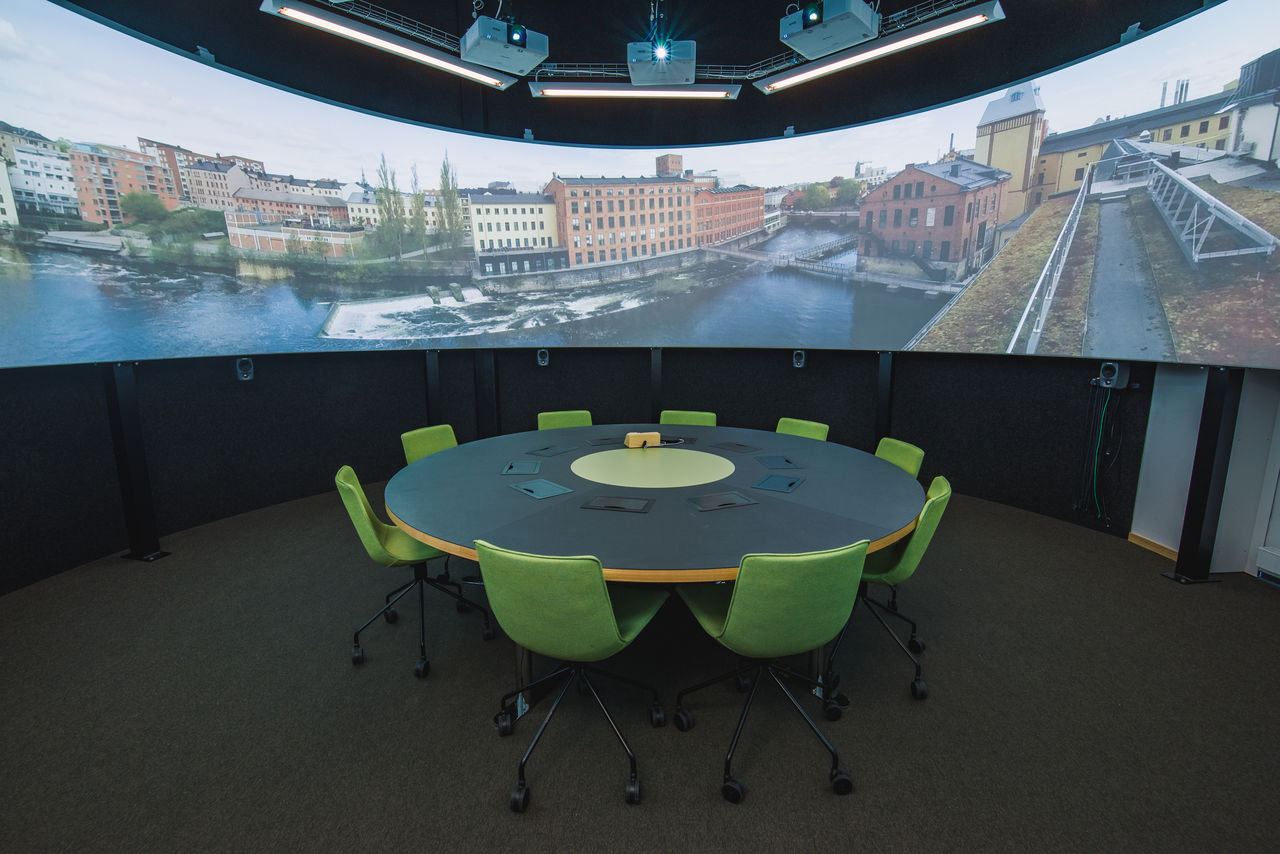
Decision Arena
2015
A cylindrical 2D visualization arena for collaborative presentations and decision-support scenarios, powered by nine Epson projectors and WATCHOUT-driven multi-display playback.
VR-arena
2010
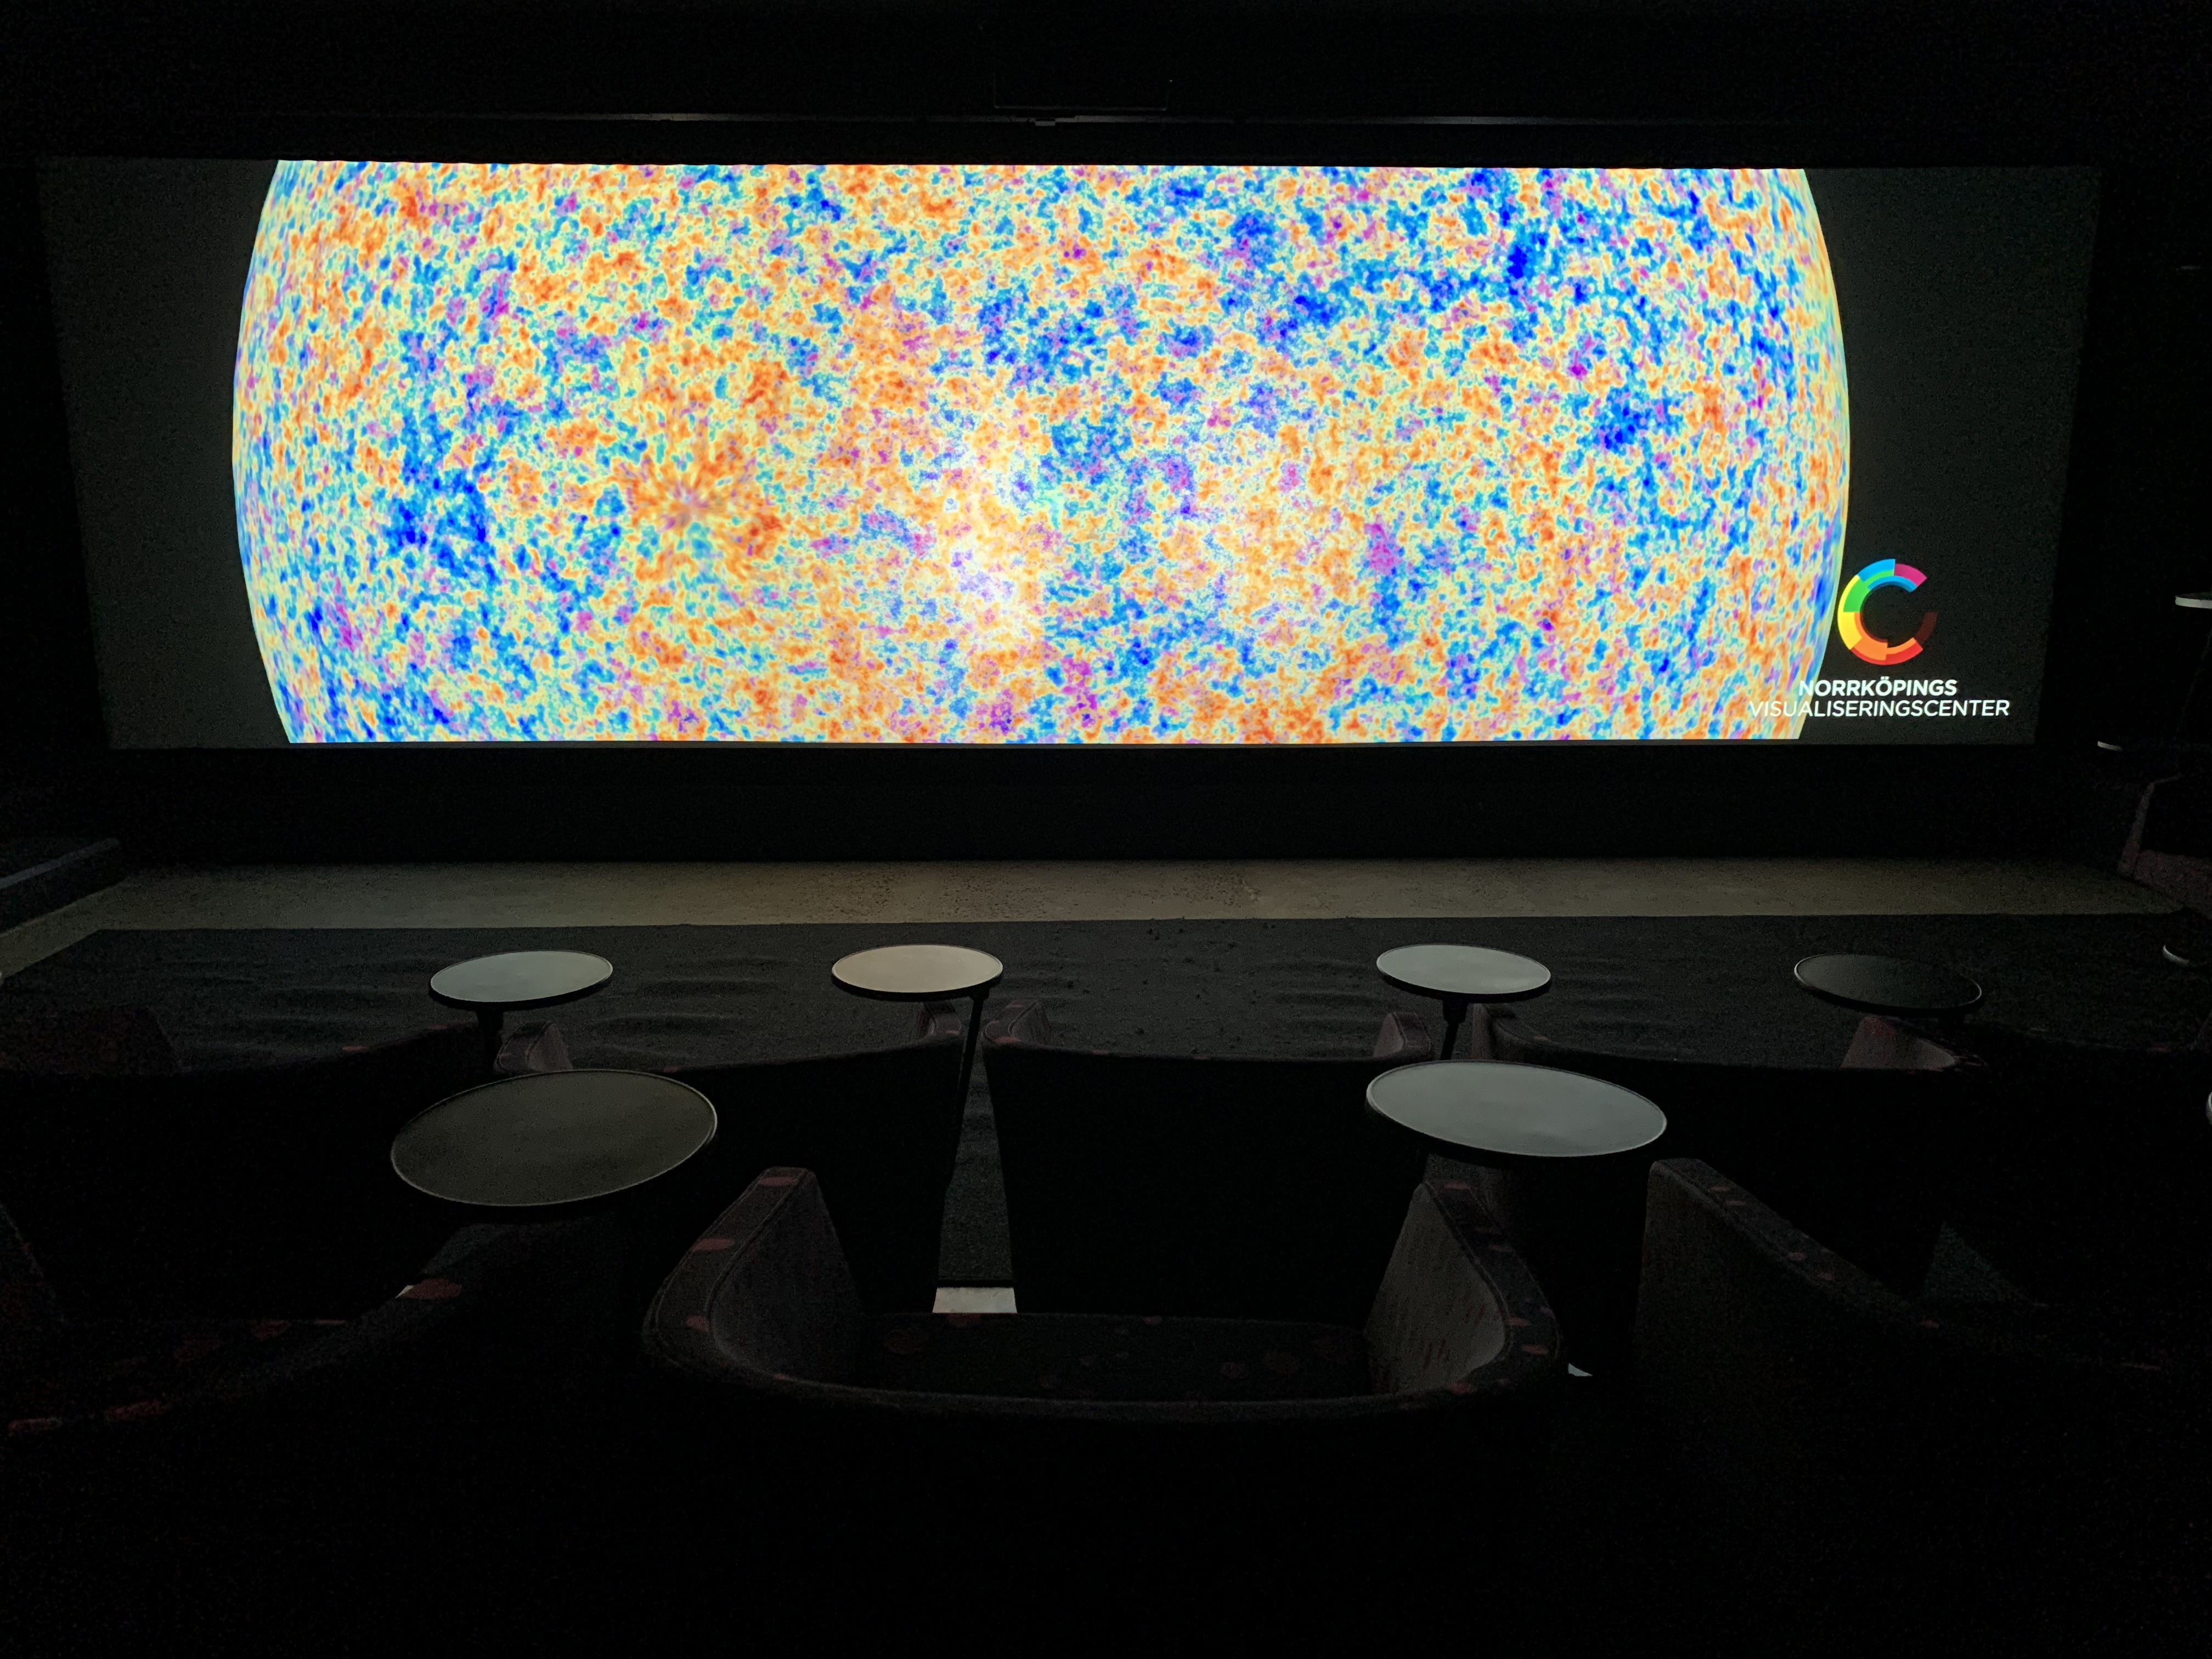
A rear-projected stereoscopic visualization arena at Visualiseringscenter C, built around a wide Stewart Filmscreen surface, three Barco projectors, active stereo, and cluster-driven presentation pipelines.
Wisdome Norrköping
2010
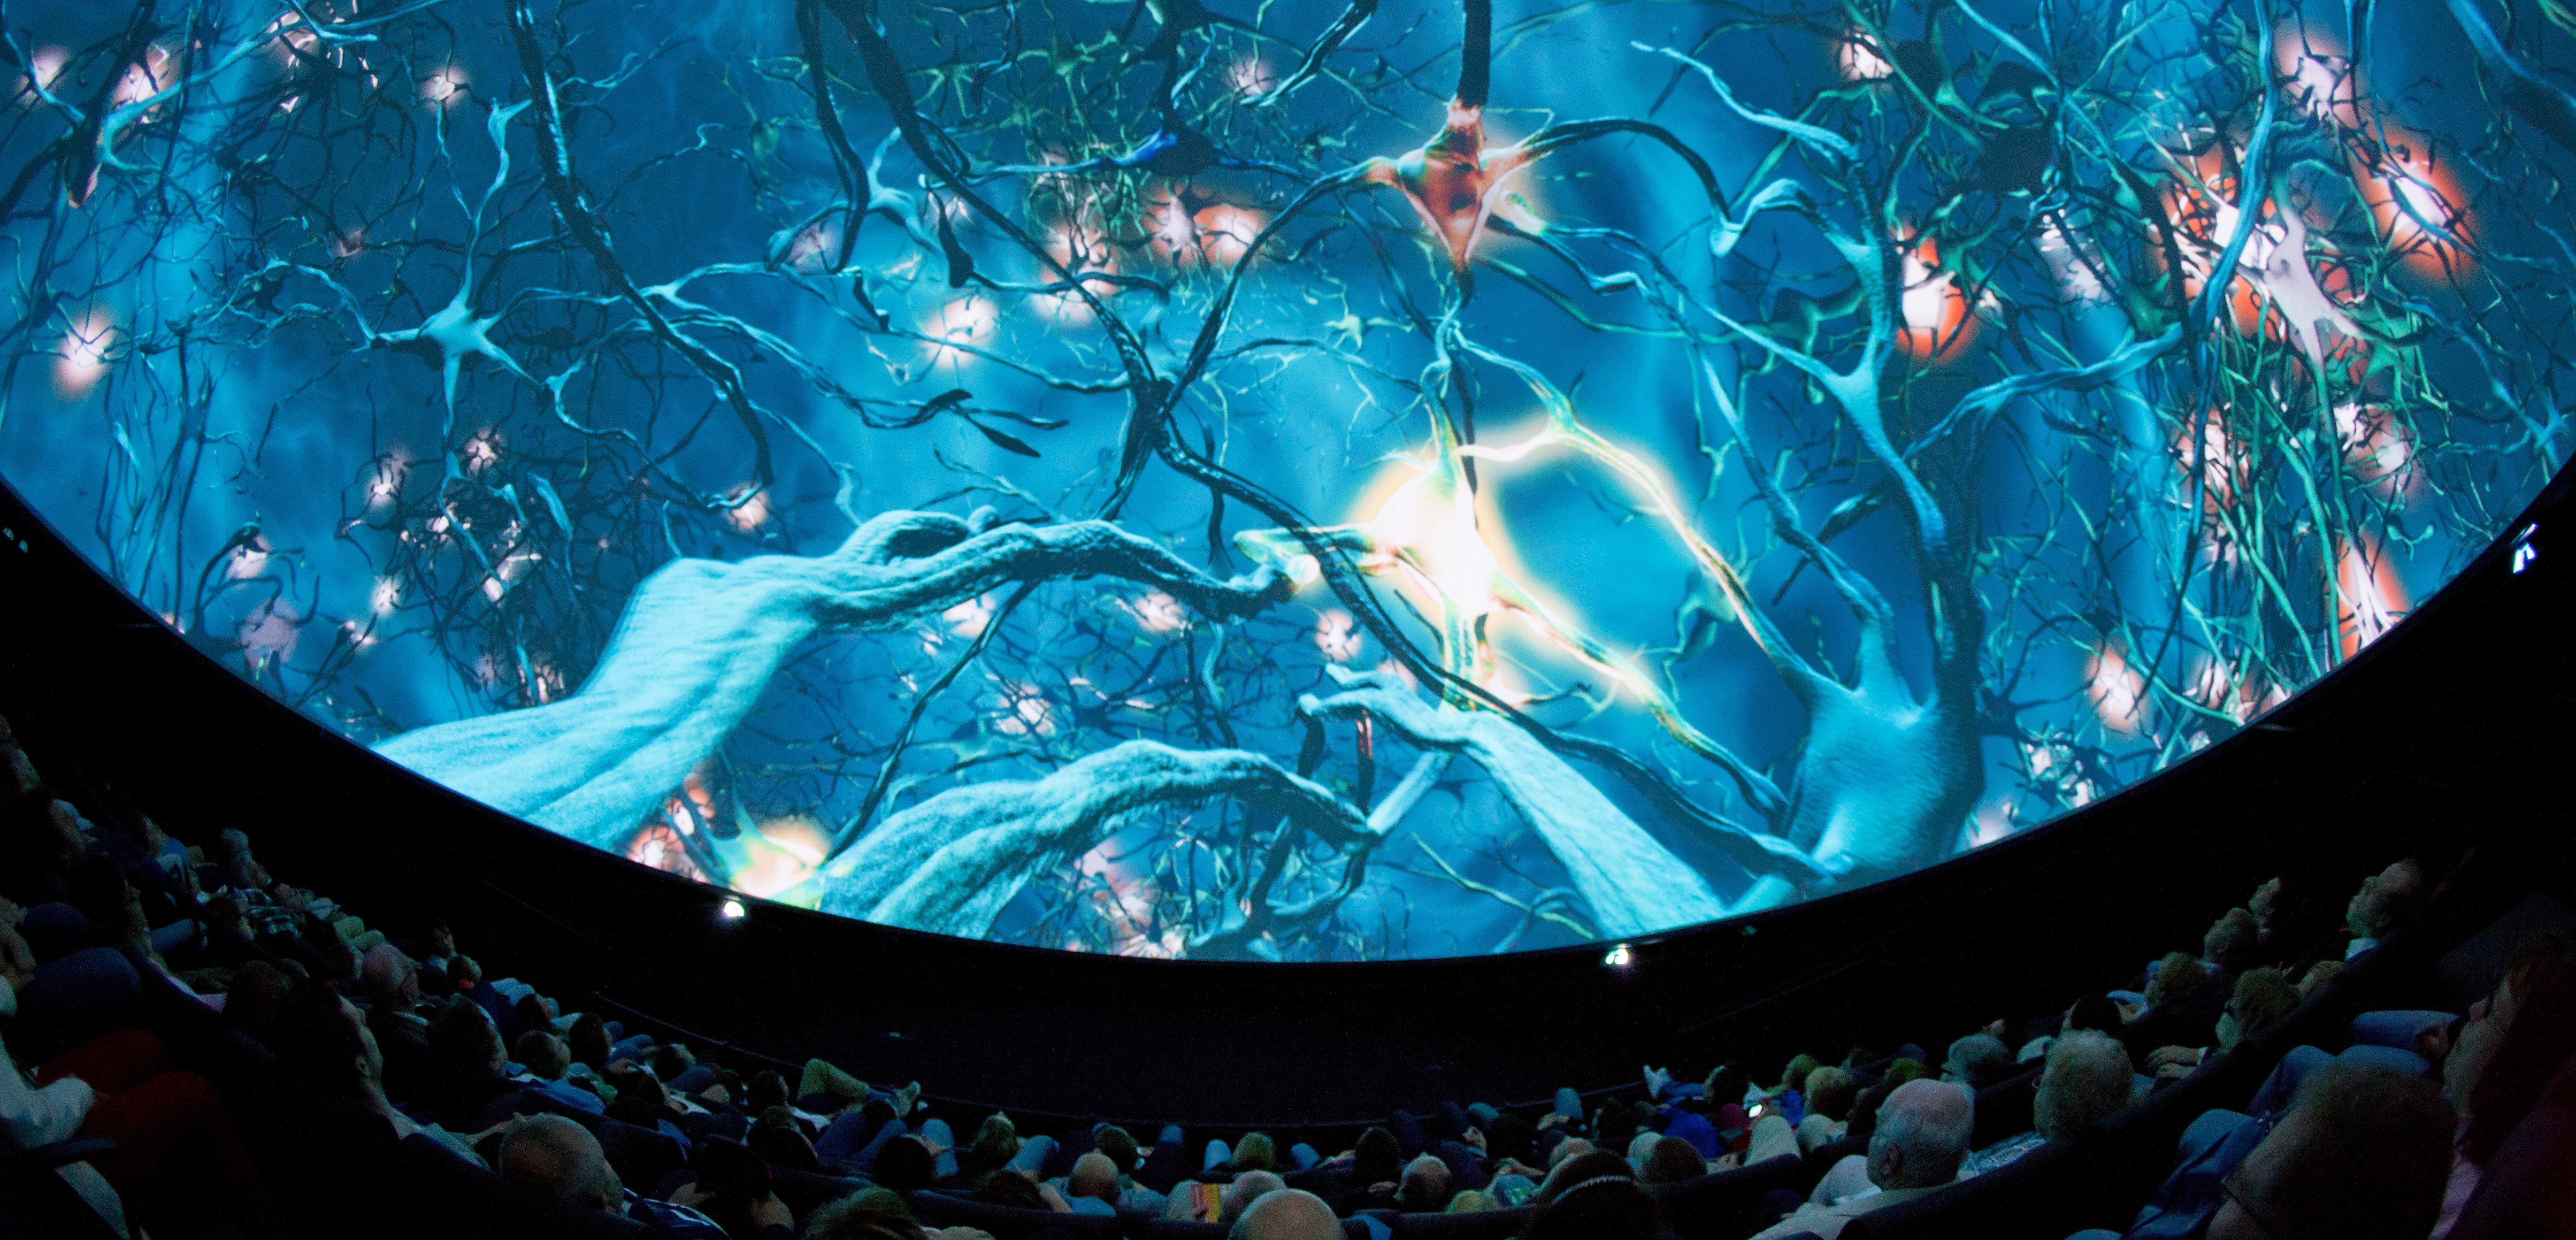
The immersive 360° dome cinema at Visualiseringscenter C, hosting cutting-edge 3D theater productions that translate complex research into unforgettable audience experiences.
Initiatives

InfraVis
2022
A Swedish national research infrastructure that provides state-of-the-art data visualization support, tools, and training across all scientific disciplines.
Visual LIFT
2020
An industrial innovation project providing small and medium-sized enterprises with access to 3D modeling, data visualization, and digital twin labs.

Wisdome
2017
A national science communication initiative spanning five Swedish science centers, utilizing advanced 3D visualization research to foster curiosity and public scientific literacy.